ThinkGeo.com    |     Documentation    |     Premium Support

ColorPalette HeatLayer

 Hello.


How i can draw map with population density ? Standart colors start from blue, but i need from yellow to the red.


    HeatLayer heatLayer = new HeatLayer(inMemoryFeatureLayer.FeatureSource);

            HeatStyle heatStyle = new HeatStyle();
            heatStyle.IntensityColumnName = "COUNT";
            heatStyle.IntensityRangeStart = ?
            heatStyle.IntensityRangeEnd = ?
            heatStyle.Alpha = 180;
            heatStyle.PointRadius = 10;
            heatStyle.PointRadiusUnit = DistanceUnit.NauticalMile;
            heatStyle.PointIntensity = ?


heatStyle.ColorPalette - ?


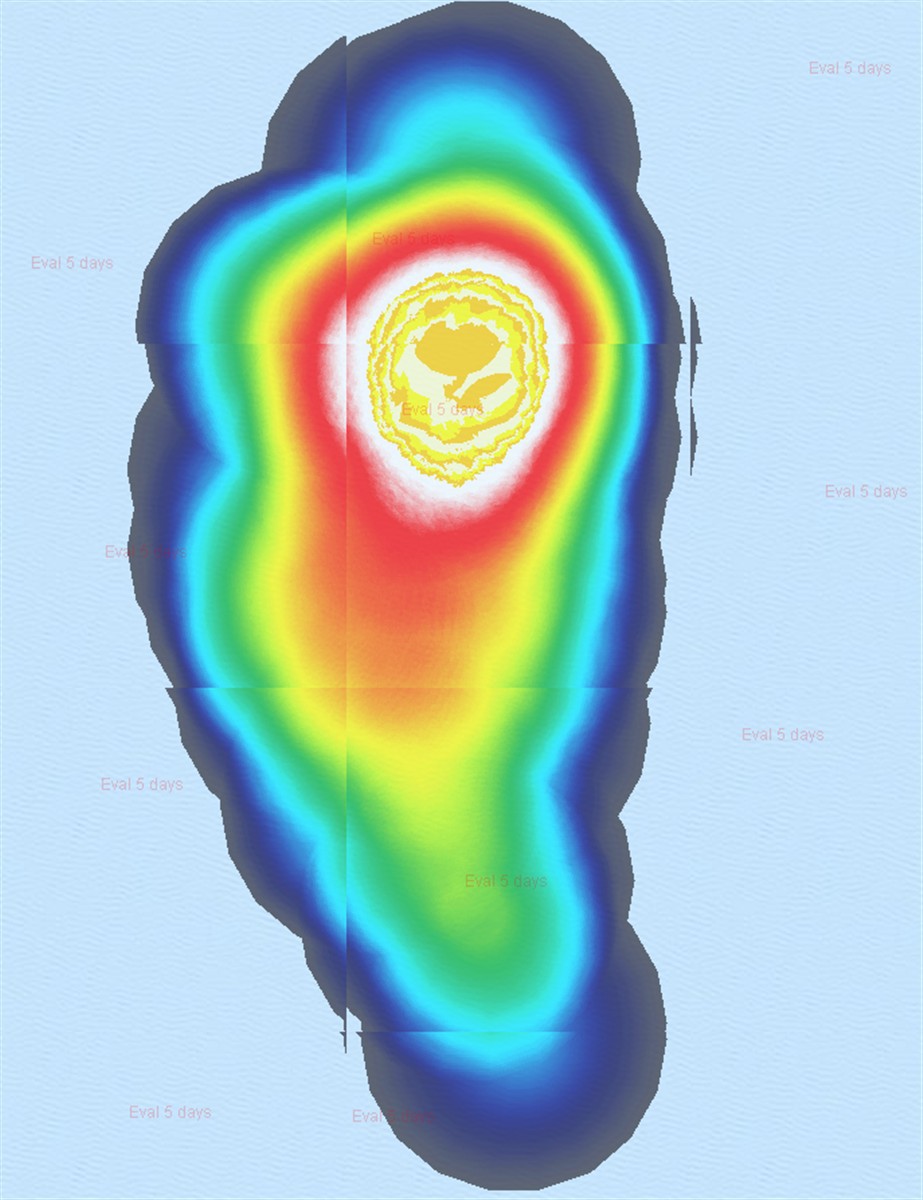
And i have problem with projection, see this on attachments


ManagedProj4Projection proj4 = new ManagedProj4Projection();
            proj4.InternalProjectionParametersString = ManagedProj4Projection.GetEpsgParametersString(4326);
            proj4.ExternalProjectionParametersString = ManagedProj4Projection.GetSphericalMercatorParametersString();


Hi Vladislav, 
  
 Could you please provide your file for us to test? We tested with our wms and the image is correct when zooming in deep. 
  
 Thanks, 
 Edgar

hm. It’s big project with 16gb DB. I think this zoom bug with Yandex projection. 
  
 And what about colors ?

Vladislav, 
  
 About the color your need to change ColorPalette members(ColorPalette is Collection<GeoColor> with 256GeoColors, ColorPalette has default 256GeoColors which are from white ColorPalette[0] in the center to blue ColorPalette[255] on the edge) 
 ColorPalette[0]=new GeoColor(Red)//Red is in ARGB format 
 …….// 
 ColorPalette[255]=new GeoColor(Yellow)//Yellow is in ARGB format 
  
 Regards, 
  
 Edgar 


thx.

You’re welcome, if you have any questions please let us know. 
  
 Regards, 
 Edgar