Hi Ashok,
Of course our map can draw it, but that’s should be complex solution.
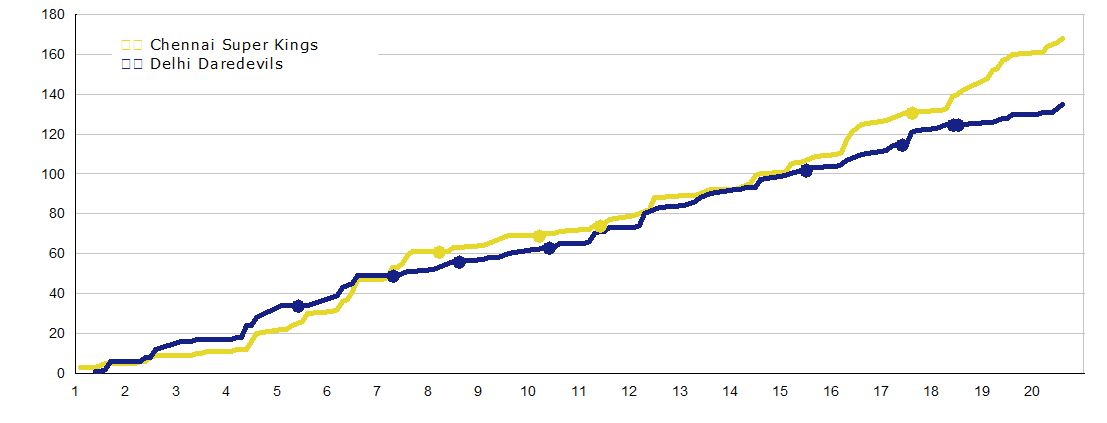
I think you just need draw a chart like your sample on map, there are two way to implement that:
-
You can use the package for example chart from Microsoft to draw the chart, then print it in an image, and print the image in our map.
-
You can write your custom layer, then directly draw shape in Graphics.
-
You can calculate the point and line, draw text as label. It’s complex and won’t looks well, we don’t suggest you implement that.
If you still need our help to implement that, you can contact your sales to get professional service.
Regards,
Ethan