
Hello @Ethan , Is there any wrapping mode option for heat map layers ? if not when you are planning to release it ?
Wrapping Mode in Heat Map Layers
Hi Bibek,
Our HeatLayer don’t support wrapping.
I think we don’t have a plan to support that, but I can double check that with our development team. They are in vacation and will back to office next week.
Regards,
Ethan
Hello @Ethan , Actually we have enable wrapping for all other layers . So, when we are panning at low zoom level in China , japan region all the heatmap layers are shifting to the wrapped map. Because of this we have go to certain zoom level so that wrapped map is not appear on the screen then only heat map is staying in the main map.
Any solution? Thanks
Hi Bibek,
We build a very simple sample, but because our heat data is not match base layer, so we hadn’t watched the shifting you mentioned.
I want to know what’s the base map you are using and more code for reproduce it, a test sample with data should be helpful.
Regards,
Ethan
Hi Bibek,
Thanks to let us know it.
Our test data cannot watch the shifting, our data is big colorful circle, it looks different in high level and deeper level, so our developer don’t know how the shifting looks like.
If you cannot provide the test data, any screen shots shows the situation is helpful.
And I am not sure whether the wrap for heat map when base use cloud layer is the correct behavior, our developer will look into it also.
Regards,
Ethan
Hi Bibek,
Our developer tried to find a test data but still hadn’t reproduced this issue.
And from the screen shot it looks the shifting is not in the deep level of China and Japan.
Could you please try the sample attached and replace the data by your data, then let us know what’s the result?
If it can be reproduced I think the udpated sample your test data should be helpful. If you don’t want to share that in forum you can put it in the netdisk for example GoogleDrive and sent the download link to me via forum message.
9448.zip (785.8 KB)
Regards,
Ethan
Here is the of sample data, it’s a csv file . First column is the coordinates and you can use 4th or 5th column to generate the heat map.
Hi Bibek,
Thanks for your csv, but I cannot render it by heat layer.
If you view our sample, you can see it render the shape file and its dbf contains a column named “CONFIRMED”. Which means if you put your data in a csv file, it should contains at least 3 valid columns, the X-coordinate, the Y-coordinate and the Intensity Column, then we can render it by heat layer. I hadn’t found the X-coordinate and Y-coordinate in your data.
If I misunderstand the data, could you please paste your parse and render code also, so we can work based on it.
Regards,
Ethan
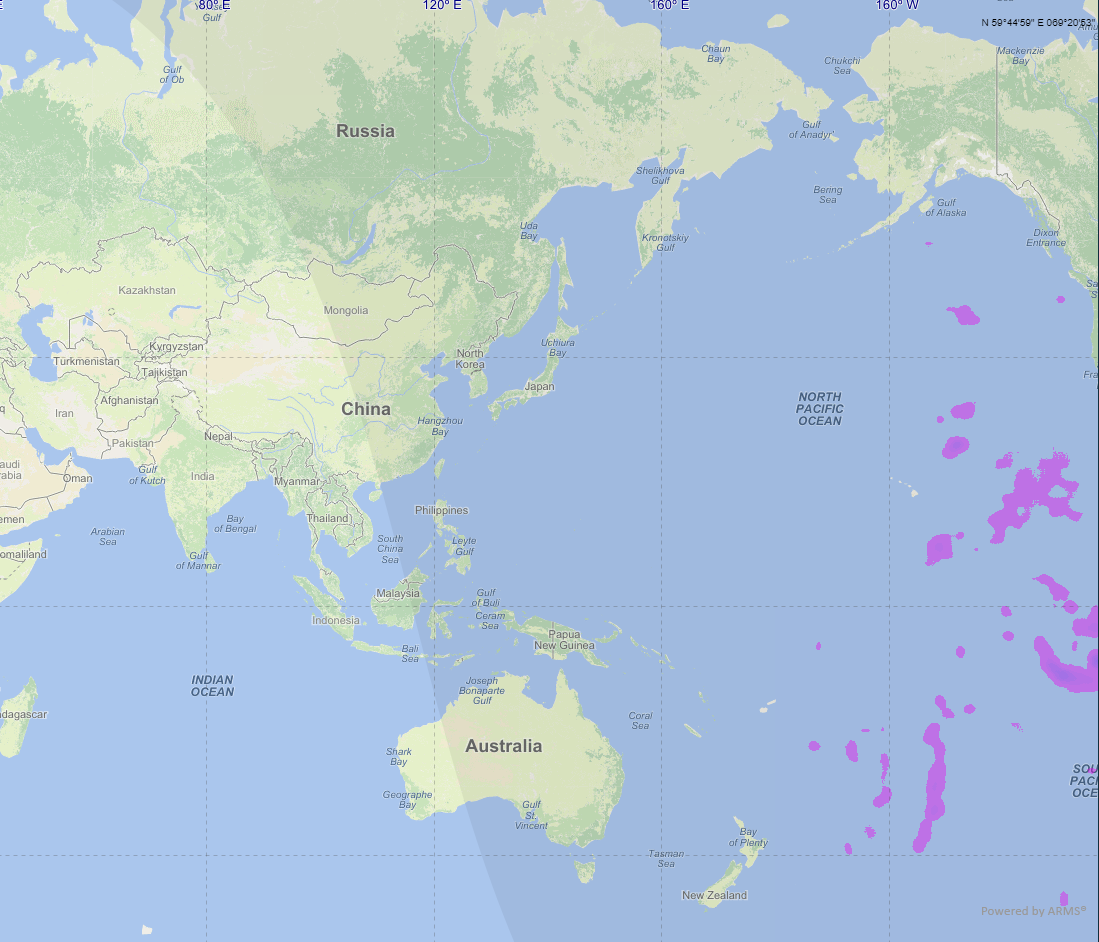
Use these to parse the first column . Another observation is at 180 degree it’s rendering wrongly . If I zoom once then it’s coming correctly.
 public double[] Str2PtAsIs(string Coords)
        {
            string sign, adeg, mins, lat="", lon="";

                if ((IsNumeric(Coords.Substring(1, 4))) && (IsNumeric(Coords.Substring(6, 5))))
                {
                    //Sign comes from degree
                    sign = (Coords.Substring(0, 1) == "N" ? "" : "-");        // If 7th position is N then +value else -value.
                    adeg = (Coords.Substring(1, 2));
                    mins = (Coords.Substring(3, 2));
                    lat = sign + adeg + "." + mins;
                    sign = (Coords.Substring(5, 1) == "E" ? "" : "-");
                    adeg = (Coords.Substring(6, 3));
                    mins = (Coords.Substring(9, 2));
                    lon = sign + adeg + "." + mins;
                }
                else if ((IsNumeric(Coords.Substring(2, 3))) && (IsNumeric(Coords.Substring(6, 5))))
                {
                    sign = (Coords.Substring(0, 2) == "EQ" ? "" : "");
                    adeg = (Coords.Substring(2, 2));
                    mins = (Coords.Substring(4, 1));
                    lat = sign + adeg + "." + mins;
                    sign = (Coords.Substring(5, 1) == "E" ? "" : "-");        // If 15th position is E then + else -.
                    adeg = (Coords.Substring(6, 3));
                    mins = (Coords.Substring(9, 2));
                    lon = sign + adeg + "." + mins;


                }


            return new double[] { Convert.ToDouble(lon), Convert.ToDouble(lat)};
        }

        private bool IsNumeric(string strNum)
        {
            Regex NotIntPattern = new Regex("[^0-9-]");
            Regex IntPattern = new Regex("^-[0-9]+$|^[0-9]+$");
            return !NotIntPattern.IsMatch(strNum) && IntPattern.IsMatch(strNum);
}Hi Bibek,
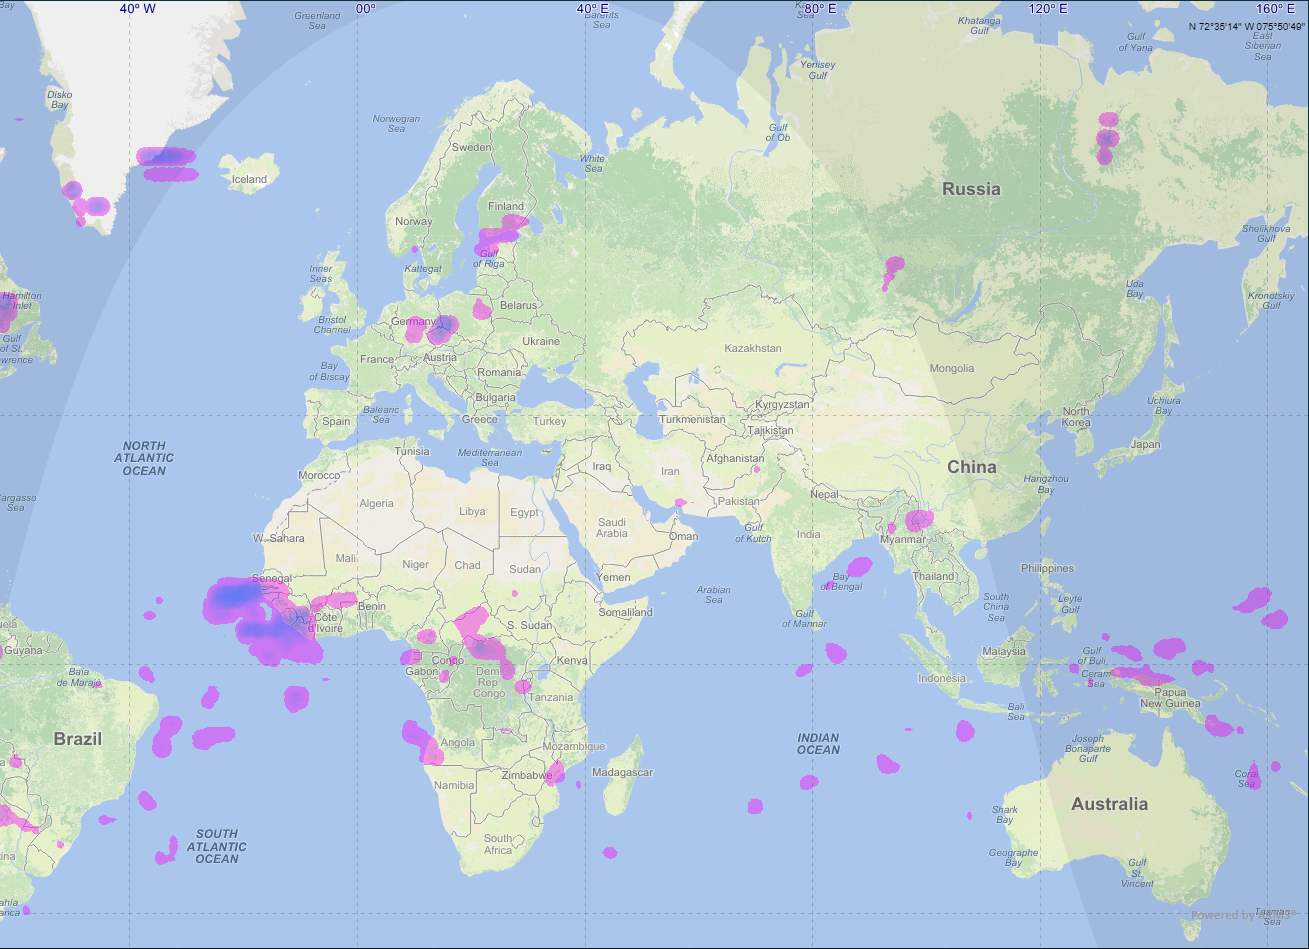
Here is the sample based on your code, but we cannot make the layer render well to match base map, we tried meter and decimal degree both(From the latitude and longitude it looks should be decimal degree).
It looks set different parameters make the result looks totally different, you can see attached image is the render result of your data here. So please modify the sample and let the sample shows the shifting just like you watched.
9448.zip (794.8 KB)

Regards,
Ethan
Thanks for your help . We figured it out the wrapping issue . Now the only issue is at 180 degree it’s not rendering properly.
Can you check that ?
Hi Bibek,
It looks that’s the other question, and we will reply you in the new topic 9462.
Regards,
Ethan
Thanks for your response 
Hi,
Any question please let us know.
Regards,
Ethan