ThinkGeo.com    |     Documentation    |     Premium Support

Latest WmsServer Version

Hey Kyle,

Thanks very much for the explanation of the queuing design for MapConfigurations as it helps me to understand the overall design behind WmsServer.

Yes, there are now 4 Worker Processes for the AppPool so I will leave that at 4 for now.

We do have a high number of requests (as high as 3-4 per second), our CPU is a VM at 2.6GH with 16GB memory. It’s running the following:
Windows Server 2012-R2
IIS V8.5.96

Our WMS Provider response time is typically under a second per request. However, I’ve seen it run the range from under a second to 20 seconds.

I’ll let you know if setting the ReadWriteTImeout helps.

Thanks,
Dennis

hi Kyle,

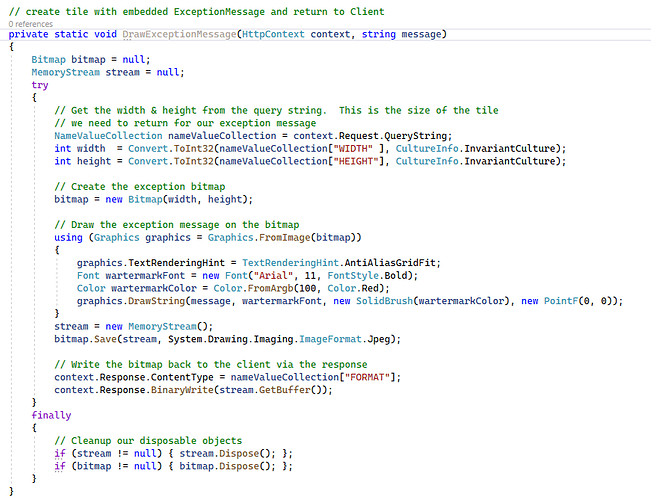
Occasionally we’ve been getting the below error rendered on the map instead of the actual imagery. I’m trying to figure out what part of the code detects and renders this on the map. I can’t find this error string in my code anywhere. In the WmsServer ASP.NET application in the Handler there is an event named DrawExceptionMessage as show below. Since the name is dimmed, I’m not sure it is even referenced as I can’t locate a reference in the application. Do you know where this error string is and how would I detect it in my application?

Thanks,
Dennis

image

Hey @Dennis,

That exception occurs in the WmsHandler class internally. The details of the exception is output to the trace log. Meaning using something like DebugView to view the exception on the server as it’s happening or create a trace listener to log it to a file. Another alternative is to include the exception in the response by setting the web.config’s customerrors section to Off.

I don’t see a reference to a DrawExceptionMessage method internally. So, I don’t think that method is ever called if it’s got 0 references in your code. I’m not sure, but maybe that’s some old code block?

By the way, I took a look at that log snippet you sent me via email. The request seems to be dropping in WmsPlugInRasterNearMapWms20.GetMapCore. I’m sure that’s calling the base.GetMapCore somewhere, but what else is being done in that method? Usually, if you don’t get a SendingWebRequest event after entering the GetMapCore, it’s because it found a match in the cache, but I’m pretty sure you do not have a cache setup for your proxy. Maybe adding additional logs around this area would be important. At the very least a GotMapCore log at the end of that method. You could also setup a try..catch block in there to see if some exception bubbles up.

Thanks,
Kyle

hi Kyle,

The update to set WebRequest.ReadWriteTImeout to 30000ms was deployed 03/21/2023 at 0845hours CST. Our proxy server has not had any issues since then. It’ll have to run 2-3 weeks before I’d be comfortable calling this the fix. Only once or twice, since this issue surfaced, has the proxy server run barely two weeks without an issue.

In the meantime, I’ve been testing our providers WMS with a test-bed application that I have, which goes directly to the providers URL, it does not use our proxy server. It has encountered errors on several occasions. If quickly/continuously panning/zooming both timeout and 502 Bad Gateway errors are encountered if one is persistent, which I am. I’ll email you the log and screen-capture. The test-bed application takes the default on the WebRequest Timers. Seeing these errors tells me that there is something amiss in their network somewhere. They are using AWS. I can recreate these errors with the test-bed application on both the server on which our proxy server is running and on my development network, which is in another State.

I installed DebugView on the proxy server 03/25/2023 and have not seen any errors in either the system or logged in DebugView.

You’re correct in that if the image is retrieved from the Tile Cache, then a SendingWebRequest is not invoked. We do have a Tile Cache, so the log makes sense.

Yes, GetMapCore does indeed invoke the base.GetMapCore. Prior to that it is doing some error checking, adding Parameters for the URL, and logging. There are no try/catch sequences so I may add a couple just to be safe.

Thanks,
Dennis

hi Kyle,

Unfortunately, setting ReadWriteTimeout does not look like the solution as on 2nd April had another occurrence of 100% CPU.

DebugView was running at the time, but there was no information there.

The ASP.NET application has a static collection used for containing some statistics. It is defined as:
System.Collections.Concurrent.ConcurrentDictionary

I was suspicious that this collection may be getting into a race-condition since all threads access the one static occurrence. A ConcurrentDictionary is supposed to be thread-safe, but I’ve read at least once that it can get in a race-condition. I removed the use of this collection for the time being and am letting the system run and waiting to see what happens. I’m not too hopeful as this collection has been running since March 2021.

Dennis

Hi Kyle,

I consider our issues resolved.

In the past we could barely run two weeks without issues and now we are one day shy of running for three weeks straight without any issues. Not only are we no longer experiencing one IIS Worker Process at 100% CPU we are also no longer seeing Process Timed Out and WMS Server Exception errors being rendered on the client maps.

It is changing the setting of the AppPool Maximum Worker Processes from four to sixteen which has resolved our issues. Observing Microsoft Process Explorer there are many times when there are seven or eight w3wp.exe threads that are busy. I’ve seen as many as fourteen active threads on more than one occasion.

Your advice & assistance much appreciated.

Regards,
Dennis
OriStar Mapping, Inc.

Hi Dennis,

That’s great to hear. Thank you for sharing the solution as well. Good work!

Thanks,
John