ThinkGeo.com    |     Documentation    |     Premium Support

Memory issues on large 4k monitors

Hello, I was wondering if there have been any reports with memory issues on large 4k monitors? Currently trying to track down the issue, but there is an out of memory exception that seems to occur more frequently the larger the map is (i.e. a maximized window on the 4k screen).

Lots of static data, but one specific overlay, containing only a single layer, gets refreshed rapidly (2-3 times per second). It contains only a single feature moving around, with some extra lines drawn around it via overriding the drawcore of the layer.

This is using the ThinkGeo v13 libraries. Is it possible it’s a skiasharp issue? It does not happen on a non-4k monitor. Not sure if there is any kind of internal cancellation of a refresh if another refresh is called for the same overlay?

Hi Dan,

This issue has been addressed in v14. Please get the latest stable version v14.2.5 and have a try.

Here you can find the explanation about this issue:
OutOfMemory exception when zooming a map - ThinkGeo UI for Desktop - ThinkGeo Discussion Forums

And here you can see we fixed another memory issue in v14.2.5.
Memory consumption with release 14 - ThinkGeo UI for Desktop / WPF - ThinkGeo Discussion Forums

Thanks,
Ben

Thanks Ben, I upgraded them but will take me awhile to update the code to handle all the async changes.

Understood, this could take some time depending on the scale of the project, but it should worth it for a long term as aync does bring in more benefits. Please let us know when you having any issues doing the upgrade.

Hi Ben, I got my app to a place where the async calls can be used without issue. However, here is what I’m seeing.

  1. The beginning of the upward slope is when the rapid refreshes of the overlay occur. Keep in mind, there is no zooming or anything during this. It’s just one feature being moved around the map. One layer, one feature, one overlay. image
  2. Diving into the peak, these are the top four things using memory image
  3. Looking at the functions using Byte[], here’s a snippet of the top calls
  4. Here’s another view

Is there anything that stands out to you as to what the issue could be?

Hi Dan,

Which version are you using? can you share your demo project with us? We are testing on 4K monitors all the time and I’m sure it handles the memory properly. I’m wondering maybe some particular methods have the leaks or something.

Thanks,
Ben

The screenshots above are using v14, but I have the same issue with v13. However, I downloaded the wpf sample projects you have and modified the vehicle gps tracking part to update every 100ms which is about what the refresh rate is in my project. I did not see the issue there. I don’t have a demo project, but I’ll see if I can throw something together over the next few weeks to reproduce.

It could very well be an issue on my side of things

No problem. Just let us know whenever you see any leaks coming from ThinkGeo. Memory Leak is always our top priority.

Ben, the memory issues that were fixed in the more recent versions that you linked to, did they relate to ProjectionConverters? Here’s a longer call stack:

There seems to be some large byte arrays. This might not be related to 4k monitors like I thought. Just maximizing on a non-4k window with rapid refreshes starts to increase memory at a drastic rate. But making the host window smaller, say a 4th of the screen size, does NOT increase the memory.

I know it’s difficult to diagnose without a sample project, but is there anything you recommend that I should be looking at that might cause this?

Hi Dan,

Neither of the 2 memory issues we fixed recently (which I mentioned earlier in this post) has anything to do with the reprojections.

The best approach is to be able to recreate it in a small demo. Besides that, I’m thinking here are a couple things you can try:

  1. can you disable ReProjection in your project for now? let’s find out if the memory has anything to do with the reprojection.
  2. If it does, are you using the ProjectionConverter or any sub class, such as GdalProjectionConverter? Can you send me the code?
  3. Also any chance you can send me the data being reprojected?

Thanks,
Ben

Hi Ben, we only have two projections, ESPG 4326 and 3857. Still working on a minimal example (everything is very tightly coupled and I have to remove all proprietary references).

Typically the map will be in the web mercator projection, but all the data is in decimal degrees/unprojected (normal lat lon coordinates ±180/±90.)

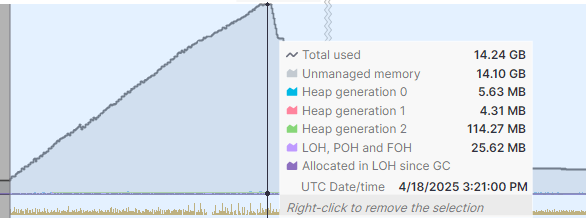
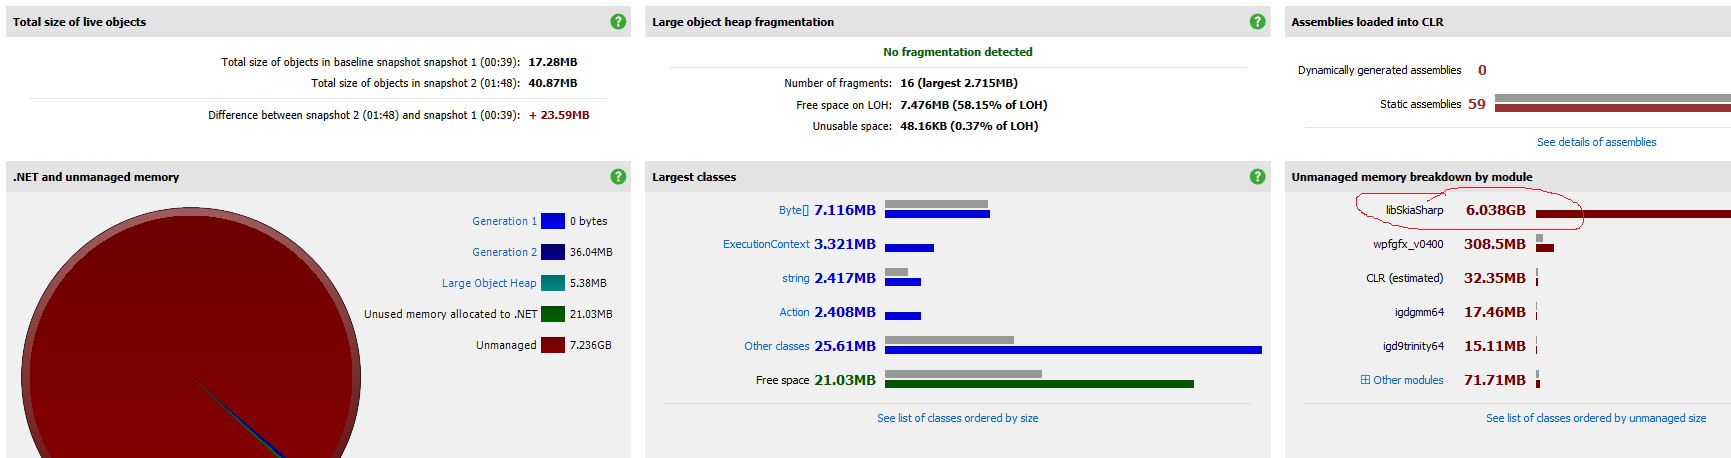
Ran another profiler, and it is showing the memory issue is in libSkiaSharp (look on right side of image)

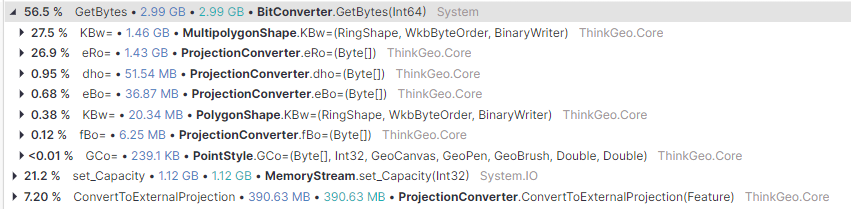
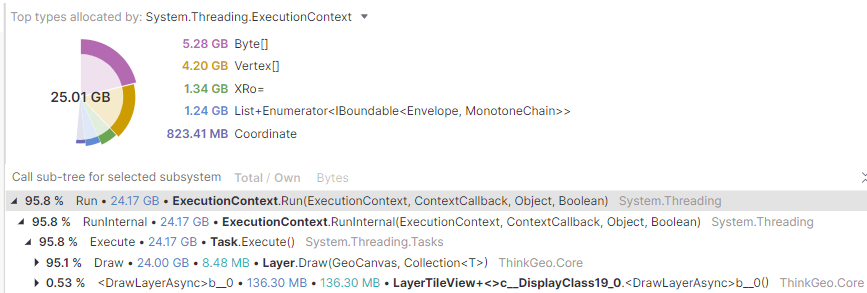
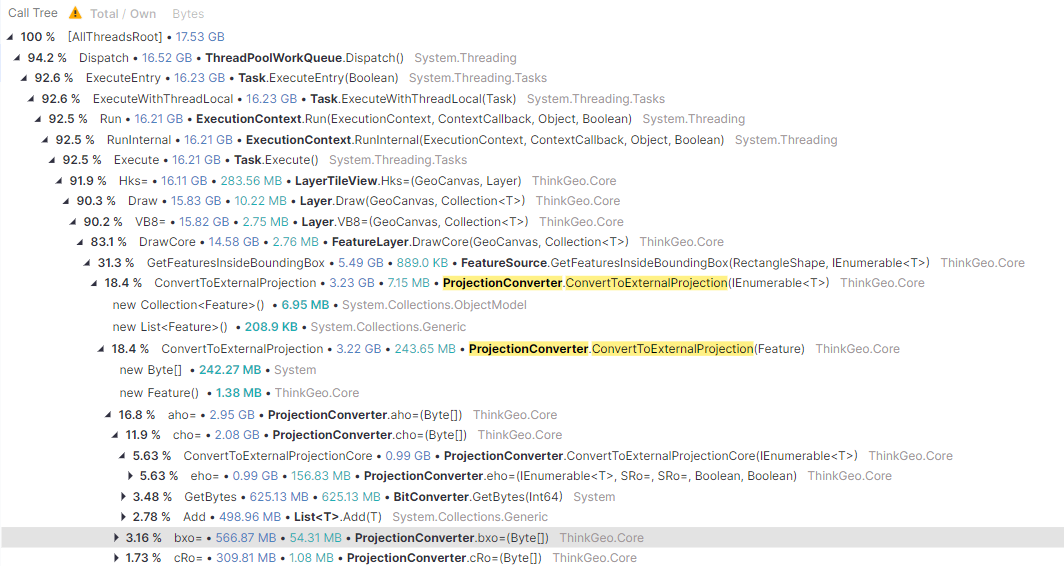
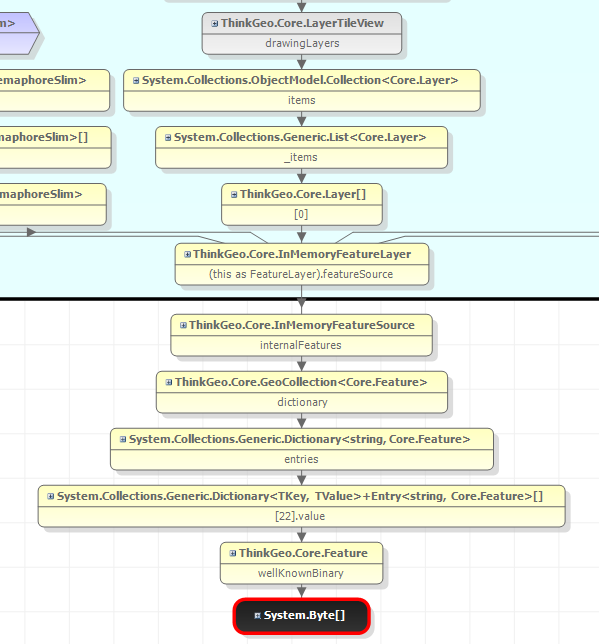
In previous screenshots I posted, there was a byte array taking up a huge amount of memory. This might stem from the wellknownbinary array according to the profiler (or it’s some byte array in skiasharp, which the profiler can’t seen into)

To recap, this happens with a high refresh rate and when the window is bigger. If I lower the refresh speed and/or shrink the window, everything seems to “catch up” and the unmanaged memory usage will start to drop.

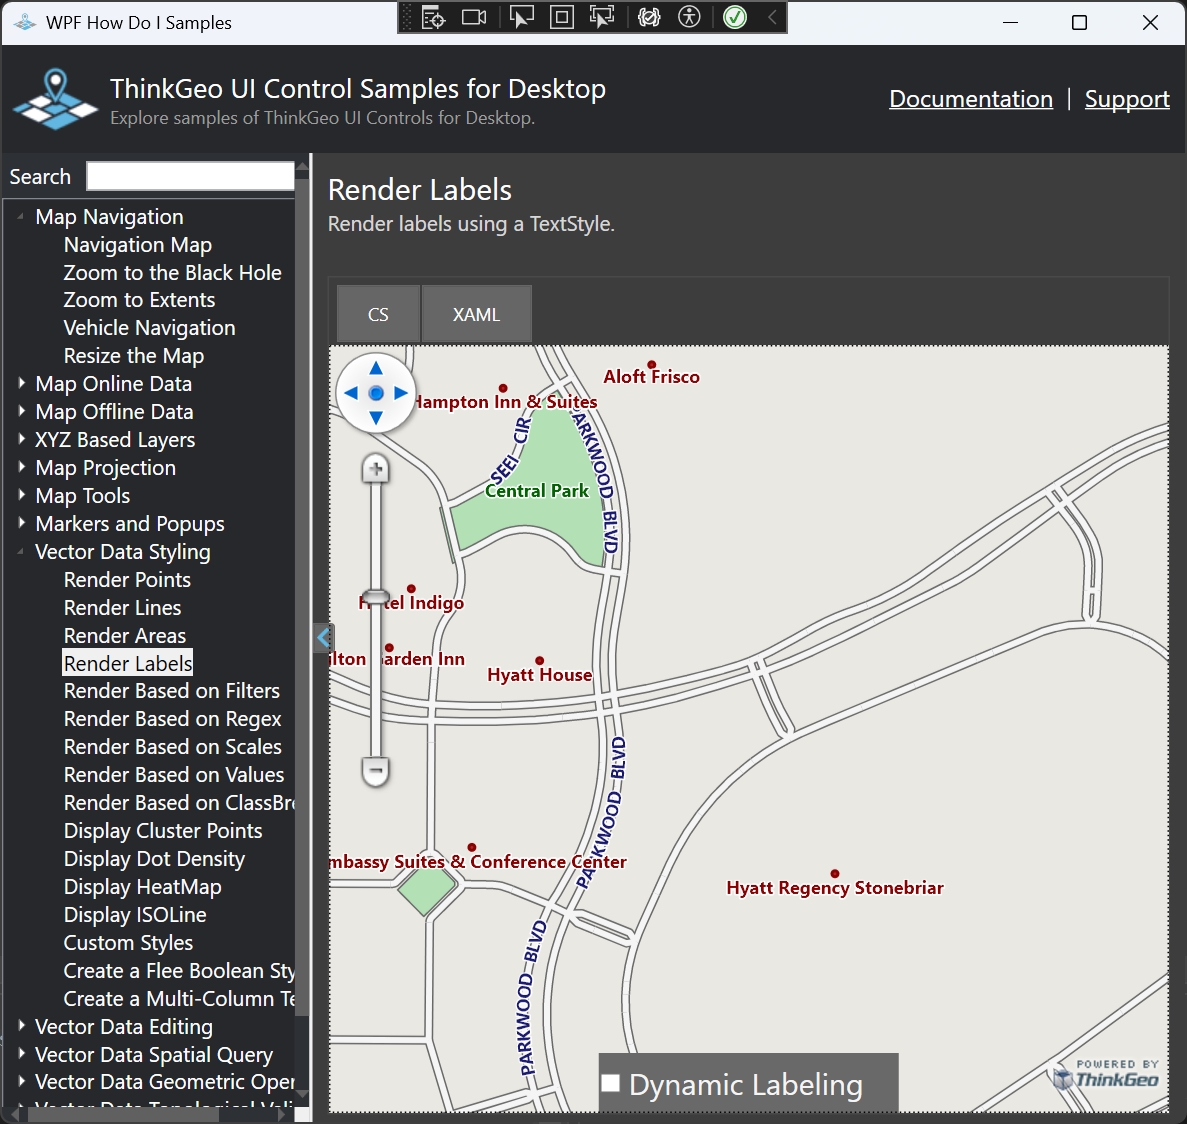
Something that may be related…what is the proper way to be updating the position of a single feature? In the samples project for the vehicle gps movement, you are simply clearing the internal features and adding another one before refreshing.

Here’s what is happening in our code:

var existingFeature = inMemoryFeatureLayer.FeatureSource.GetFeatureById(featureName, ReturningColumnsType.AllColumns);
var shape = (PointShape)existingFeature .GetShape();
shape.X = longitude; //set a new longitude
shape.Y = latitude; //set a new latitude
shape.Id = existingFeature.Id;

//Make a new feature based on the new shape location
var newFeature = new Feature(shape, existingFeature.ColumnValues);

// check if we are in mercator projection
if (currentProjection == mercatorProjection)
{
    //Add an extra step with Mercator to convert to proper values
    PointShape ps = (PointShape)feature.GetShape();
    ps = (PointShape)MercatorProjConv.ConvertToInternalProjection(ps);

    newFeature = new Feature(ps, existingFeature.ColumnValues);
}

inMemoryFeatureLayer.InternalFeatures[existingFeature.Id] = feature; //feature

From there, we either do a map.CenterAt(shape) or a map.Refresh(map.CurrentExtent, someOverlay). It seems a bit convoluted, and it was written back when v10 libraries were the latest I believe. Maybe we shouldn’t be making a new feature based off of the existing one?

Hi Dan,

  1. Based on your description—“If I lower the refresh speed and/or shrink the window, everything seems to ‘catch up’ and the unmanaged memory usage starts to drop”—this doesn’t look like a true memory leak. What’s happening is that on a 4K monitor the LayerOverlay continually regenerates full-screen (4K) bitmaps behind the scenes, which spikes memory usage until GC reclaims them.

  2. For real-time updates of just a few features, there’s a much more efficient pattern. In the dev branch’s HowDoI sample samples/wpf/HowDoISample · develop · ThinkGeo / Public / Desktop Maps · GitLab, you’ll find a “Vehicle Navigation” demo that:

  • Updates only the moving feature (the blue route in the demo), rather than re-rendering the entire 4K map each frame.
  • Uses LayerWpfDrawingOverlay instead of LayerOverlay . That lets you draw individual geometries directly to the canvas.
  • Optionally animates the update, you can easily switch it to a fixed interval (e.g. refresh every 100 ms) or implement the smooth animation following the pattern in the demo.

Notes:
a. This feature is currently available only in our beta branch. It will ship in v14.3 (expected the first week of May).
b. We may tweak a few API names before the final release (for example, renaming LayerWpfDrawingOverlay to FeatureLayerWpfDrawingOverlay ), but there will be no major changes.

Let me know if it works for you.

Thanks,
Ben

Hi Dan,

Just FYI here is another sample, where by checking/unchecking the Dynamic Labeling checkbox, it switches between LayerOverlay (renders on the image and then post the image on the map) and WpfDrawingOverlay (render the features directly on the canvas without creating an image). Please have a try.


Thanks,
Ben

Hi Ben, that LayerWpfDrawingOverlay seems really interesting and I think is something we would definitely use. I will try it out soon, thank you!

I have been trying to re-recreate a minimal project to show the memory usage, but have been unable to so far.

What does Layer.RequestDrawing() do? I haven’t seen any documentation for this, and there’s no comments on the function so I assume it’s not recommended. However, I replaced the overlay.Refresh calls on the hot path with layer.RequestDrawing(), and the memory issue goes away. Is it essentially telling the map to redraw that specific layer when it is free? I was going to write up my own throttling type function for each overlay but if RequestDrawing() does something similar then maybe I don’t have to.

Hi Dan,

You’re right—those RequestDrawing() APIs will soon be marked Obsolete . They’re designed to refresh the layer every time after the layer.RequestDrawingInterval , but in practice their behavior brings in lots of confusion, for example you can’t tell exactly which/when overlays will redraw, and what will happen if other operations kick in in the middle of the rendering. As a result, we now recommend that clients trigger redraws explicitly, with that you get full control and much cleaner code.

Under the hood, RequestDrawing() uses a DispatcherTimer to enqueue Tick callbacks on the UI dispatcher, which only run when the timer elapses and the UI is idle, that’s why you saw a better memory usage with RequestDrawing(). You can get the same “run when idle” behavior by simply posting your RefreshAsync() at a low dispatcher priority, for example:

            async Task DoDeferredRefreshAsync()
            {
                var op = Application.Current.Dispatcher.InvokeAsync(
                    () => layerOverlay.RefreshAsync(),
                    DispatcherPriority.ApplicationIdle // Try different priorities and see which one fits your scenario
                );
                await op.Task.Unwrap();
            }

Thanks,
Ben

Thanks Ben! That makes sense.

Ben, an update regarding the 4k monitor. It happens when the scaling for that display is set to 100%. If set at the recommended scaling (in my case it says 300%), there isn’t a memory issue. Not sure what can be done about that. Have you seen anything similar in your testing?

Hi Dan,

At 100% scaling, more features are fetched and rendered compared to 300%. For instance, displaying the same geographic extent (e.g., a city) at 300% might only show major roads, while at 100%, it includes detailed streets. So even on the same 4K monitor, 100% scaling results in more data being processed, which naturally consumes more memory.

Also, just a quick reminder: if you’re frequently refreshing the map, consider using the FeatureLayerWpfDrawingOverlay(was LayerWpfDrawingOverlay), which draws directly onto the canvas rather than generating a full 4K image, and you can refresh just the overlay instead of the entire map. Combined with caching, this approach can significantly reduce memory usage.

Thanks,
Ben