ThinkGeo.com    |     Documentation    |     Premium Support

Get Road Orientation?

Hi there.


I was wondering if there was any way to get the position and orientation of road labels from a layer, without actually rendering them?

As per the sample that we sent to ThinkGeo last week, we are looking to implement our own layer for displaying road labels, and it would make it a lot easier for us if we could get hold of the position of the labels, and their orientation so that we could render them ourselves.


Brendan, 


Thanks for your post. 


I'm not sure what do you mean by "render them ourselves". seems you still want to keep our positing logic, does that mean you want to keep the same position/orientation and just render differently ? If that's the case, maybe you can simply inherite our PositionStyle and override the render methods. Could you let me know more about your scenario? 


Anyway, here is a way to get all the positing info for labeling. Generally, you only need to inherite a canvas without overriding any code, draw a map with that canvas, you can get all the info from the protected methods. 


 public partial class Form1 : Form
    {
       // ......
        private void Form1_Load(object sender, EventArgs e)
        {
            ShapeFileFeatureLayer layer = new ShapeFileFeatureLayer(@"C:\Program Files\ThinkGeo\Map Suite Desktop Full Edition 3.0 (BETA)\Samples\SampleData\Data\USStates.shp");
            layer.ZoomLevelSet.ZoomLevel01.DefaultAreaStyle = AreaStyles.Country1;
            layer.ZoomLevelSet.ZoomLevel01.DefaultTextStyle = TextStyles.Country1("STATE_NAME");
            layer.ZoomLevelSet.ZoomLevel01.ApplyUntilZoomLevel = ApplyUntilZoomLevel.Level20;

            layer.Open();
            Bitmap bitmap = new Bitmap(800, 600);
            myGeoCanvas geoCanvas = new myGeoCanvas();
            geoCanvas.BeginDrawing(bitmap, layer.GetBoundingBox());
            layer.Draw(geoCanvas, GeographyUnit.DecimalDegree, new Collection<SimpleCandidate>());
            layer.Close();
            pictureBox1.Image = bitmap; 
        }
    }

    class myGeoCanvas : GdiPlusGeoCanvas
    {
        protected override void DrawTextCore(string text, GeoFont font, GeoBrush fillBrush, GeoPen haloPen, IEnumerable<ScreenPointF> textPathInScreen, DrawingLevel drawingLevel, float xOffset, float yOffset, float rotateAngle)
        {
            // Here you can get all the info for drawing text. 
            base.DrawTextCore(text, font, fillBrush, haloPen, textPathInScreen, drawingLevel, xOffset, yOffset, rotateAngle);
        }
    }


Any queries/comments please let me know. Very pleased to see your original view on our products. 


Ben 


Thanks for this Ben. We’re going to play around with it and see if it will fit our requirements. 
  
 Our scenario: 
 We really want a more interactive mapping environment, and what we’re looking to do is build our own WPF layer on top of the map in order to get that environment. The sample we sent displayed a subset of the type of interaction we are trying to get out of a mapping control. David mentioned some challenges we would face in doing rotation for example. The example we sent was how we would try solve that particular challenge (We haven’t got a response from David as of yet to get his input… but I assume there is a lot going on at the moment at ThinkGeo). 
  
 We are looking to render the labels ourselves (on our own WPF layer) so that we can change their X and Y scale to keep the labels readable at any orientation with smooth rotation. In our sample, we used a crude method of label placement in order to position the labels (with a very simple rotation calculation). In the interest of not having to redo work that has been done, we are looking for the correct placement of the labels to start with. We’ll take a look at what you posted above (thank you very much:P), and hopefully this will work for us. 
  
 Thanks again Ben. The help is appreciated.

Hello, 
  
 Ben, I tried your example out and it works exactly as you say it would for the US States shape file (USStates.shp) but when I try and use the Austin Streets shape file (Austinstreets.shp) the example does not work.   
  
 I have tried it using other shape files and have found a trend, it would seem that the example works fine for area shape files (USStates.shp) and point shape files but not for line shape (Austinstreets.shp) files. 
  
 Could you please confirm what I think is the issue and explain why it works this way. 
  
 Thanks. 


Ian, 
  
 That’s because I set the AreaStyle only. 
   layer.ZoomLevelSet.ZoomLevel01.DefaultAreaStyle = AreaStyles.Country1; 
  
 If you want to display a line based shape file, you need to set the default LineStyle. 
 Layer.ZoomLevelSet.ZoomLevel01.DefaultLineStyle = LineStyles.Highway1; 
  
 also for point based shape, you need to set the point style 
 worldLayer.ZoomLevelSet.ZoomLevel01.DefaultPointStyle = PointStyles.Capital1; 
  
 Ben

Ben,


Thanks for your reply.  Sorry for the delay on my side, I was on leave and have now returned.    


The issue I am having is not drawing the lines/points/areas but drawing the text data (road name) for the associated road line shape.

To give you some background, I want to get the road name label information (Position to draw, angle of text, etc.) for the road that is going to be drawn.  I am going to then use that data to draw the road name labels myself on a WPF canvas.  


So when I run my logic (you can find that just below) and have the layer reference the area shape file (USStates.shp) and apply a Default Text Style, the state names are drawn correctly.  When I comment out the two lines of code that reference the layer to the area shape file and uncomment the two lines that will associate the layer to the line shape file (AustinStreets.shp) and do no other changes, the road names do not appear.


So in a nutshell, for this particular layer I am not interested in drawing the shapes but only the names of each shape.  The issue is that the names do not draw when using line map shape files but do draw when using area map shapes from what I can see and I find quite odd.


Following is my logic:


    public partial class Form1 : Form
    {
        public Form1()
        {
            InitializeComponent();

            // AREA SHAPE FILE AND ASSOCIATED DEFAULT TEXT STYLE - DRAWS THE NAMES CORRECTLY
            ShapeFileFeatureLayer layer = new ShapeFileFeatureLayer(@"..\..\..\MapData\USStates.shp");
            layer.ZoomLevelSet.ZoomLevel01.DefaultTextStyle = TextStyles.Country1("STATE_NAME");

            //// LINE SHAPE FILE AND ASSOCIATED DEFAULT TEXT STYLE - DOES NOT DRAW THE NAMES OF THE STREETS
            //ShapeFileFeatureLayer layer = new ShapeFileFeatureLayer(@"..\..\..\MapData\Austinstreets.shp");
            //layer.ZoomLevelSet.ZoomLevel01.DefaultTextStyle = TextStyles.Country1("FENAME");  // FENAME taken from the "Austinstreets.dbf" file
            ////layer.ZoomLevelSet.ZoomLevel01.DefaultTextStyle = TextStyles.CreateSimpleTextStyle("FENAME", "Arial", 10F, DrawingFontStyles.Regular, GeoColor.SimpleColors.Blue);
            

            //// COMMENTED OUT BECAUSE I AM NOT INTERESTED IN DRAWING THE ACTUAL LINE OR AREA SHAPES FOR THIS LAYER
            //layer.ZoomLevelSet.ZoomLevel01.DefaultAreaStyle = AreaStyles.Country1;
            //layer.ZoomLevelSet.ZoomLevel01.DefaultLineStyle = LineStyles.LocalRoad1;

            // Draw logic
            Bitmap bitmap = new Bitmap(800, 600);
            ExtendedGdiPlusGeoCanvas extendedCanvas = new ExtendedGdiPlusGeoCanvas();

            layer.ZoomLevelSet.ZoomLevel01.ApplyUntilZoomLevel = ApplyUntilZoomLevel.Level20;

            layer.Open();
            
            extendedCanvas.BeginDrawing(bitmap, layer.GetBoundingBox());

            layer.Draw(extendedCanvas, GeographyUnit.DecimalDegree, new Collection<SimpleCandidate>());

            layer.Close();

            pictureBox1.Image = bitmap;
        }
    }


Ian,


Sorry for the misunderstanding, I thought it in a much simpler way. :P In fact thanks for pointing this issue out as it provides me a chance to learn the labeling system more myself. J
 
First I did a small change in your sample. I saw you created an 800 * 600 bitmap and put it in a pictureBox, which may not fit so well with that bitmap. So I created the bitmap with the pictureBox’s size instead.
Bitmap bitmap = new Bitmap(pictureBox1.Width, pictureBox1.Height );
 
Here is the result running your demo, I added the LineStyle just for easier understand.


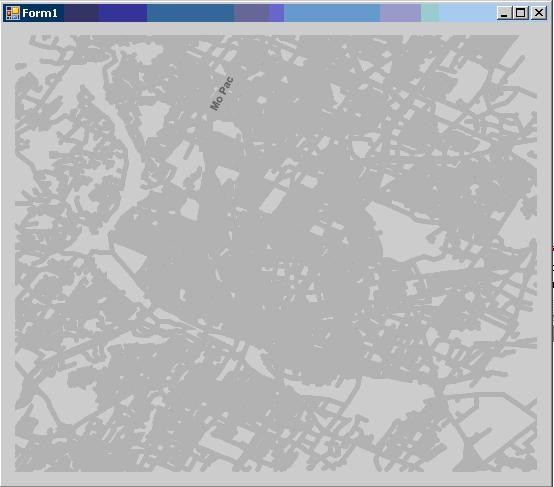
Why only one label is displayed. One reason is that as all the roads are shown in the map, the length of each road is very small. To avoid the case that you have a long label for a short line, we just ignore drawing the labels for that case. We have a property TextStyle.TextLineSegmentRatio(0.9 by default), if a road’s label is longer than road.Length * TextStyle.TextLineSegmentRatio, it will not be displayed.


I added the following code and have another try. (I set it to double.MaxValue so there is no limit)
layer.ZoomLevelSet.ZoomLevel01.DefaultTextStyle.TextLineSegmentRatio = double.MaxValue;


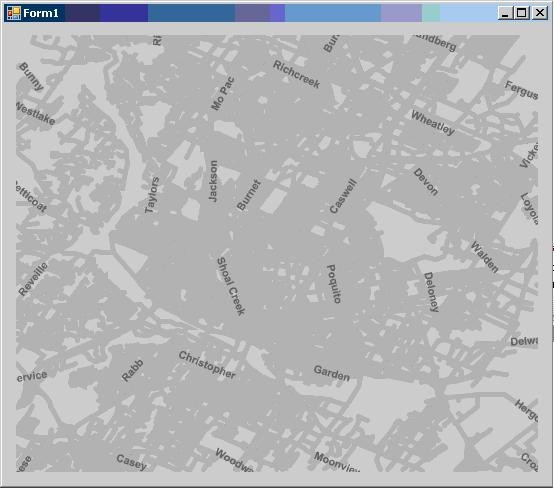
Still seems not have enough labels? That’s because to avoid having too many labels in one small area, we divided the map into many grids and each grid we allow to draw at most one label.  We has a property TextStyle.GridSize to set the size (in integer) of the grid, by default is 100.
 
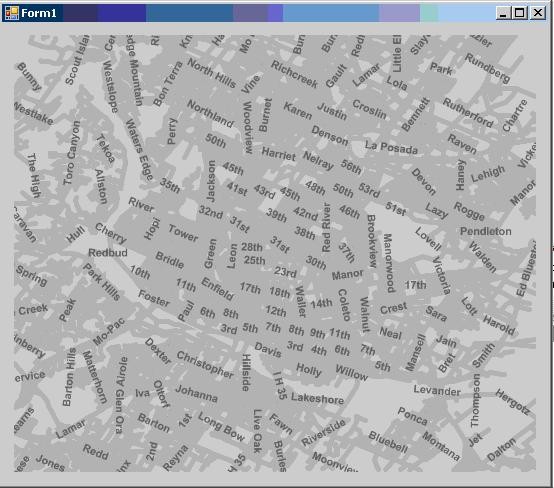
Adding the following line to the code, here is the result.
layer.ZoomLevelSet.ZoomLevel01.DefaultTextStyle.GridSize = 5;


(I cannot post 3 pics in one post, so please see my next post as part 2)


(Part 2)


By default, overlapping is not allowed for labeling. Sure you can enable it by setting TextStyle.OverlappingRule to AllowOverlapping. With the following codes added, the result will be like this.


layer.ZoomLevelSet.ZoomLevel01.DefaultTextStyle.OverlappingRule = LabelOverlappingRule.AllowOverlapping;


I hope that helps. Here is the code and any queries just let me know.


public Form1()
        {
            InitializeComponent();

            // DOES NOT DRAW THE NAMES OF THE STREETS
            ShapeFileFeatureLayer layer = new ShapeFileFeatureLayer(@"C:\Program Files\ThinkGeo\Map Suite Desktop Full Edition 3.0 (BETA)\Samples\SampleData\Data\Austinstreets.shp");
            layer.ZoomLevelSet.ZoomLevel01.DefaultLineStyle = LineStyles.LocalRoad3;
            layer.ZoomLevelSet.ZoomLevel01.DefaultTextStyle = TextStyles.Country1("FENAME");  // FENAME taken from the "Austinstreets.dbf" file
            //layer.ZoomLevelSet.ZoomLevel01.DefaultTextStyle.OverlappingRule = LabelOverlappingRule.AllowOverlapping;
            layer.ZoomLevelSet.ZoomLevel01.DefaultTextStyle.TextLineSegmentRatio = double.MaxValue;
            layer.ZoomLevelSet.ZoomLevel01.DefaultTextStyle.GridSize = 5;
            
            // Draw logic
            Bitmap bitmap = new Bitmap(pictureBox1.Width, pictureBox1.Height );
            ExtendedGdiPlusGeoCanvas extendedCanvas = new ExtendedGdiPlusGeoCanvas();

            layer.ZoomLevelSet.ZoomLevel01.ApplyUntilZoomLevel = ApplyUntilZoomLevel.Level20;
            layer.Open();

            RectangleShape shape = layer.GetBoundingBox();
            extendedCanvas.BeginDrawing(bitmap, shape);

            layer.Draw(extendedCanvas, GeographyUnit.DecimalDegree, new Collection<SimpleCandidate>());
            layer.Close();
            pictureBox1.Image = bitmap;
        }

Ben.

Ben, 
  
 Thank you for the detailed reply, it all makes a lot more sense now…  
  
 I am going to go and play with what you have elaborated on now. 
  
 Thank you.

Great! just let us know for any more queries.