ThinkGeo.com    |     Documentation    |     Premium Support

How to Save an Image of large map with high zoom level

Hello!

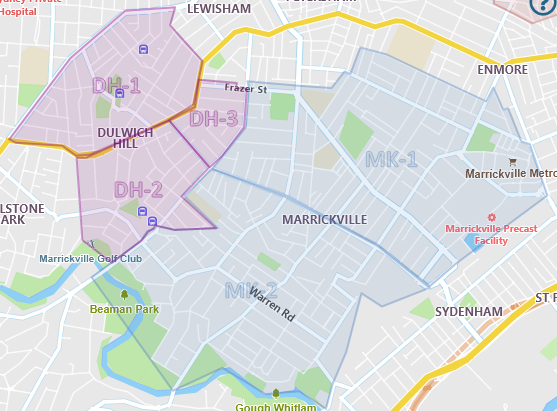
In our WPF application, the MapView contains an OpenStreetMapOverlay, plus several Polygon Shape layers on top.

I can set the mapView.CurrentExtent to fit all polygons on screen at once by creating a RectangleShape that covers all Polygons, E.G.

mapView.CurrentExtent = new RectangleShape(minX, maxY, maxX, minY);

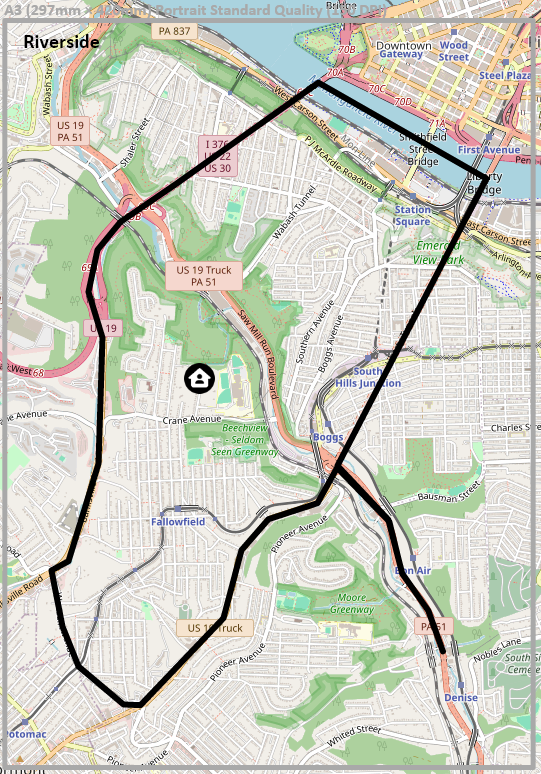
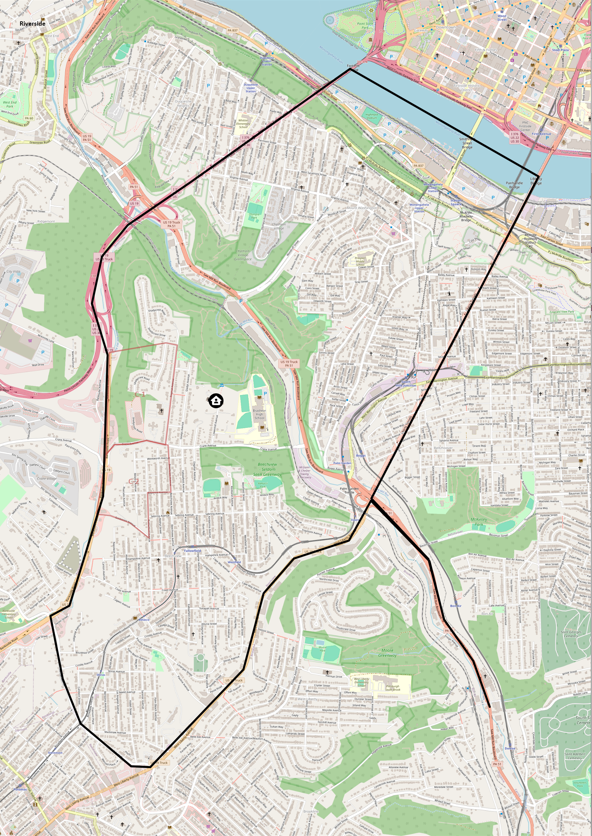
However since the map is very large, the map is then Zoomed out a long way. This is fine for displaying in the application, since you can easily Zoom and Pan. But we would like to save an Image of the entire Map Extent at a high Zoom level.

We are using GetSnapshot(), which works very well:

var snapShot = mapView.GetSnapshot();
snapShot.Save(dialog.FileName);

However, if we Zoom in, the Map Extent changes to what is shown on screen, not the whole map. If we stay zoomed out so we can see the whole map, then the Zoom Level is too small.

How can we save an image of the whole map, Zoomed in?

Thanks!

Hi @Damian2,

Thanks for your post. The quick answer is that the GetSnapshot() function will only snapshot the extent and scale that’s rendered on the map.

But there may be a way to do this with a custom layer depending on the complexity of your project. How many layers or overlays are you wanting printed? Do you have some sample code or a description of the number and types of layers and overlays your app is rendering?

thanks,
John

Hello and thanks for your response. A custom layer should be fine, the project is not too complex.

We basically have an osmMapsOverlay which shows the map, e.g.

OpenStreetMapOverlay osmMapsOverlay = new OpenStreetMapOverlay();
mapView.Overlays.Insert(0, "osmMapsOverlay", osmMapsOverlay);

Then we have multiple InMemoryFeatureLayer “Category” Layers (contains MapPolygon features with text). These are added to the layerOverlay, which is added to the MapView. There might be 5, 10 or more category layers, but they are simply built in a foreach loop. This should be fairly standard.

LayerOverlay layerOverlay = new LayerOverlay();
foreach (var category in Categories)
{
  var categoryLayer = new InMemoryFeatureLayer();
  var feature = new Feature(territory.MapPolygon, territory.ID.ToString());
  feature.ColumnValues.Add("TextStyle", territoryDisplayName);
  categoryLayer.InternalFeatures.Add(feature.Id, feature);
  layerOverlay.Layers.Add(category.ID.ToString(), categoryLayer);
}
mapView.Overlays.Add("layerOverlay", layerOverlay);

The result is something like this (each color is a different Category):
2024-05-02 22_49_50-

Hi Damian,

You need to call ThinkGeo Low-Level Drawing APIs for something like it. Here is the demo code:

    // In this case we need to use the layer instead of an overlay
    var osmLayer = new OpenStreetMapLayer("userAgent");
    var youOtherLayer = new InMemoryFeatureLayer();

    // Open the layers

   var centerPoint = new PointShape(0, 0);
    // the result image is 1000 by 1000
    var geoImage = new GeoImage(1000, 1000);
    var geoCanvas = new SkiaGeoCanvas();

    // here set the extent of the map. You can get the centerPoint from your mapView's CurrentExtent. 500000 here is the scale, set it to the one you want, for example you can do zoomlevelSet.ZoomLevel15.Scale if you want to use the scale of ZoomLevel15 of a given zoomLevelSet
    var worldExtent = MapUtil.GetExtentFromCenterPoint(centerPoint, 1000, 1000, 500000, GeographyUnit.Meter);
    
   // Draw your layers on the canvas
    geoCanvas.BeginDrawing(geoImage, worldExtent, GeographyUnit.Meter);
    osmLayer.Draw(geoCanvas, new Collection<SimpleCandidate>());
    youOtherLayer.Draw(geoCanvas, new Collection<SimpleCandidate>());
    geoCanvas.EndDrawing();

    geoImage.Save(@"c:\result\result.png"); 

Let us know if you have any questions.

Thanks,
Ben

Hi Ben,

That is great, thanks. I’ve managed to create what I need, however I am having trouble with the Scale/DPI differences between what is shown on the screen, and what is saved/printed, especially when we save different paper sizes and resolutions.

Please see the following 3 screenshots. The first one is what is shown on the screen at Zoom Level 14. Notice how thick the borders are, the Text Size in the top-left corner, and the Icon size. This is what we want to see when we save/print, regardless of paper size or DPI.

Now please see screenshots 2 and 3.
Screenshot 2 is A3 @ 150dpi, which was created with:
geoImage = new GeoImage(1754, 2480);

Screenshot 3 is A2 @ 300dpi, which was created with:
geoImage = new GeoImage(4961, 7016);

All 3 images have the same worldExtent.

Clearly, the border width, font size, icon sizes, etc. all need to be increased for the larger GeoImages. However I am unsure what the relationship is between what is shown on screen at Zoom Level 14, and what is printed.

By what factor do we increase the widths or sizes? How can we calculate this?

Thanks,
Damian

Screenshot 1 - On screen - Zoom Level 14
Screenshot 2 - A3 @ 150dpi
Screenshot 3 - A2 @ 300dpi

Hi, Damian,

This is a classic question when dealing with high-res images. Let me see if I can make it clear.

Let’s see I want to draw New York City on a 100 * 100 image, and it will be at zoomlevel5 for example. And under this zoomlevel I can only see the island of Manhattan maybe, not the streets.

Now if I draw New York City on a 1000 * 1000 image, I have 2 options:
a. Draw the city using a more detailed zoomlevel, for example zoomlevel8, under which I can see the streets and buildings.
b. Still draw the city under zoomlevel5, so it will show exactly the same thing in that 100*100 image but everything is larger.

You were doing Option A in your ScreenShot 2 and 3: same extent and more detailed zoomlevel. And the same 10-pixel-width line will look thinner in a larger image. But what you want is Option B, a 10-pixel width line on Screenshot 1 will be a 20 pixel on Screenshot 2, so they look the same.

You can accomplish that by setting GeoCanvas.ScaleFactor. By default it’s 1, if you set it to 2, a 10 Width line will be changed to 20. This is what we do when displaying the map on mobile devices (for example ScaleFactor = 3 on iOS retina screen) or on a high-res screen. And for the above sample: draw New York City on 1000*1000 image with ScaleFactor = 10, will then give you the same but bigger image.

Some notes here:

  1. I’m a bit confused about DPI you mentioned above. Regarding your question: “By what factor do we increase the widths or sizes?”, it depends on the size of the image you are looking for, you can just set it to whatever you want, and change the ScaleFactor accordingly. Please let me know if I missed anything here.
  2. It’s OK for vector rendering, however it will have some issue for the OpenStreetMap background you are using. OpenStreetMap doesn’t provided High-res tiles, which means it will always draw a 256 * 256 tile and stretch it, and of course it will be blurry. There are a couple options to fix it:
    2.1, Option A: Use a map provider which provides high-res tiles, and request those high-res tiles if you ScaleFactor is greater than 1. For example GoogleMaps provides scale=2 images, you can see from the following link/image about the difference between scale=1 and 2. ( Get Started | Maps Static API | Google for Developers)
    . ThinkGeo Cloud also provides high-res tiles, same idea, you can see an online sample here. ThinkGeo Cloud Online Samples - Build Better Mapping Apps Faster

2.2 Option B: If scale=2 is not good enough for you, you can consider rendering vector tiles, in which all features will be drawn on the fly so you will have the highest resolution. ThinkGeo provides vector tiles as well, you can use ThinkGeoCloudVectorMapsLayer with the demo keys in the HowDoI sample to have a quick try: samples/wpf/HowDoISample/Shared/SampleKeys.cs · develop · ThinkGeo / Public / Desktop Maps · GitLab

Hopefully all this makes sense. Let us know if you have any questions.

Thanks,
Ben