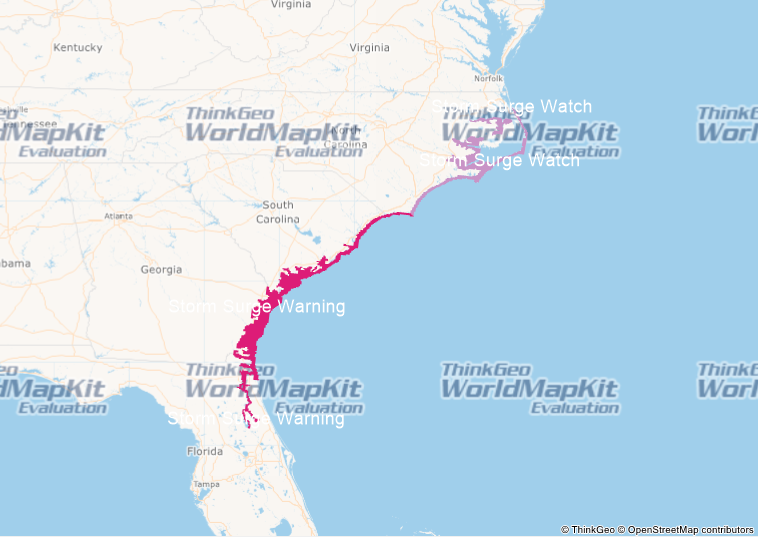
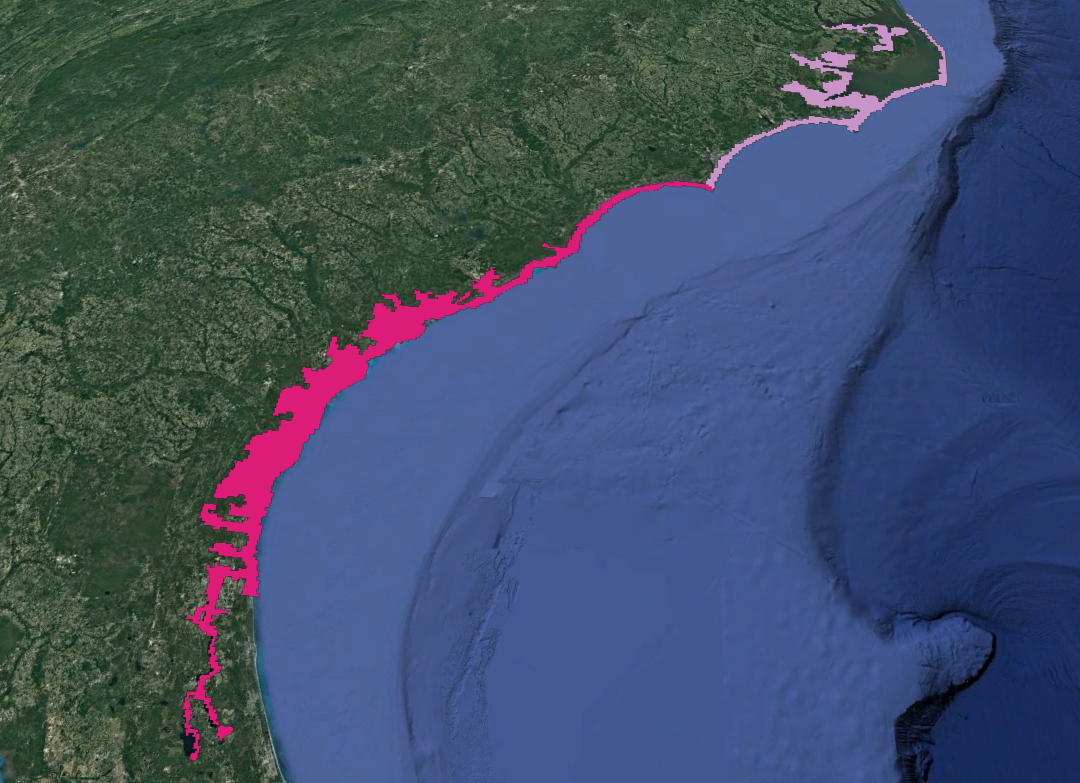
I am looking to show a .kml file on our map, but, after creating the KmlFeatureLayer and adding it to the overlay, when Map.Refresh is called, I get an error about the KmlFileName.IDX file missing. I didn’t think I needed another file other than the .KML file.
I can open the .KML file in Google Earth without any issues.
Thanks, I’ve got it showing now. Here is the next issue:
The .kml file has two different Styles with a color defined, and polygons listed using each style, so that the data shows up using that color. You can see it in Google Earth working correctly.
How do I get the two styles to draw on my ThinkGeo map? If I set a default area style, ALL of the data shows up in that color, and not the colors there are supposed to be. If I don’t set a default area style, nothing shows on the map.
I can use .QueryTools to get the different colors, but how do I then set the data/polygons to draw using their correct colors?
Display KML data no need set any style, the file already contains the style data, MapSuite can know how to render that. We created one simple to display your data, it works fine exactly sample with Google Earth. please refer the attachment sample. if there is any issue, please let us know that. KmlDemo.zip (32.3 KB)
I think our problem comes from the fact that our MapUnit is set to Meters, not DecimalDegrees, though I’m still not totally sure what that problem is. This code shows the layer, but all data is in yellow:
    Dim layerOverlay As New LayerOverlay()
    Dim kmlLayer As New KmlFeatureLayer(fileName, KmlStylingType.StandardStyling)
    KmlFeatureSource.BuildIndexFile(fileName)
    kmlLayer.FeatureSource.Projection = proj4
    kmlLayer.ZoomLevelSet.ZoomLevel01.DefaultAreaStyle = New AreaStyle(New GeoSolidBrush(GeoColor.SimpleColors.Yellow))
    kmlLayer.ZoomLevelSet.ZoomLevel01.ApplyUntilZoomLevel = ApplyUntilZoomLevel.Level20
    layerOverlay.Layers.Add(kmlLayer)
    Me.Map.Overlays.Add(layerOverlay)
    Me.Map.Refresh()
Nothing shows up if I do any of the following:
Remove the styling type
Remove the ZoomLevelSet lines
Remove the Projection line
What is odd is that, in your sample, if I change the MapUnit to Meters, I could see the data as it is supposed to be. Maybe I’m changing a setting in my code that affects this.
Any other thoughts on this? I’ll keep playing with it and let you know if anything changes.
I have been playing around in a test project, and found out a few things. The test project’s MapUnit is set to Meters.
When I use the following code:
Dim layerOverlay As New LayerOverlay()
Dim kmlLayer As New KmlFeatureLayer(fileName)
KmlFeatureSource.BuildIndexFile(fileName)
layerOverlay.Layers.Add(kmlLayer)
kmlLayer.Open()
Me.Map.CurrentExtent = kmlLayer.GetBoundingBox
Me.Map.Overlays.Add(layerOverlay)
Me.Map.Refresh()
what I see is the data in the correct colors, but only at the most zoomed-in level possible, and not at the correct location on the map. It is very hard to make out, as it is so small on the map. Any zooming out makes it disappear. If return the code that sets the projection, and the ZoomLevelSet lines, plus the StylingType option, then I can see the data as expected, but in the yellow of the DefaultAreaStyle.
This again makes me think it has something to do with the conversion to Meters from DecimalDegrees.
My guess is that when I add the KML layer without the projection line, the ZoomLevelSets lines, and the StandardStyling setting, it is actually showing up on my map, but in the wrong place, and is only visible at the most zoomed in levels, like I am seeing it in the test project.
If you switch to Meter for your MapUnit in your demo project, you can see something similar occurring.
If you would like my test project, I can send it to you.
Thanks for your detail information, our developer had reproduced your problem.
As below is the research result and some suggestions:
Our map don’t support embedded style work together with projection, that’s why you cannot get the correct result.
We think you can do something like this:
If you can accept all data with same color (same style), you can use custom style replace embedded style, it can works. Or you can try to split the KML to some separated KML files based on style, then draw them in different layers.
You can try reprojection your base layer to decimal degree, if your baselayer cannot support that, you can try our WorldMapKit, which have 4326 and 900913 two types.
I’ll look into splitting this particular KML file into two files. We just spent the last few moths moving our code over to use Web Mercator/Meters for our projection, so going back to decimal degrees is not an option. Can we expect an update that will allow KML files to work correctly with a meters MapUnit in the future?
When the layer draws on the map, the < Placemark >< name > values show on the map. Is there a setting that prevents this? They don’t show on something like Google Earth.
We will be getting the KML file from the National Hurricane Center. We could change it if needed, but this seems like something the layer should be able to handle.