ThinkGeo.com    |     Documentation    |     Premium Support

Memory usage - intense?

Hi All,
We’re getting reports from customers of their system freezing when using the newest version which includes TG14. The previous version of our software used TG10 and there were no such problems. Our investigations have led us to an interesting memory behaviour in TG that may be part of it…

We did some experiments with the previous version of our system (TG 10) and the newest (TG 14).

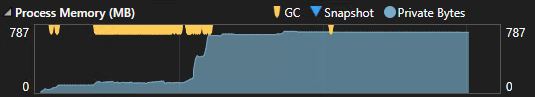
In the TG 10 version, the system starts up and memory usage settles at around 500-600MB
v10_startup

If you pan repeatedly, the memory usage increases quite drastically, but is repeatedly pulled back, giving the “sawtooth” graph…

(by “pan repeatedly” I mean drag the map with the mouse, then within a second or two do it again, and again and so on…)

In TG 14 version, the startup memory usage settles at around 800MB - a tiny bit higher than V10 but not a problem.
v14_startup

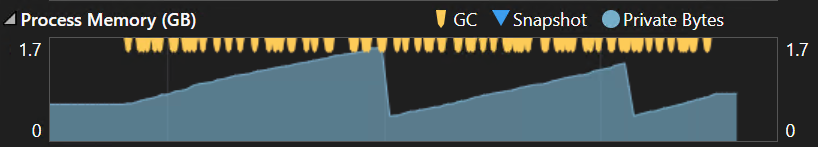
But if you pan repeatedly, the memory usage quickly increases… and just keeps on increasing… In the screenshot below, the memory usage was up to 8GB but if you keep panning, it just keeps going up, we’ve seen 12GB or more.

If you stop panning and leave it to “cool down” then after a minute or two the memory is recovered eventually and after a few minutes it settles back down to the starting point of around 800MB - but that peak usage is what we think might be causing problems on customers’ PCs which typically have a maximum of 16GB RAM.

Is there something we can be doing to mitigate this? I recall in the dim and distant past a manual GC was an option, but this was later eliminated? Any advice would be appreciated.

Thanks!
J.

Some further information - we’ve experimented further and it looks like the memory recovers much more quickly when raster layers are not involved - this could be linked to raster layers… (?)

Hi Jason,

1, Which version of TG14 were you using in the test?
2. You mentioned raster layers, so what kind of raster layer did you use?

Something could be related:

  1. In the recent versions we enabled a memory cache with 50 tiles by default. Please add the following code to disable the cache. (We are thinking about disabling it by default in the next release)
    tileOverlay.TileViewInMemoryCache = new XyzLruCache(0);

  2. The SkiaRasterLayer (for loading regular raster files, such as png, jpg…) would always pre-load the entire file, which has been improved in the latest beta (v14.4.0-beta047) which only loads the tile in the current extent. Pull the latest beta if you are using SkiaRasterLayer.

We didn’t see this memory leak in our everyday test but it could be a specific layer having the memory leak. Let us know the layers in your project and we can have a better idea.

Thanks,
Ben

Hi Ben,
We’re currently using 14.4.0-beta37
The raster in question is a series of GeoTiffRasterLayer, each using a plain TIFF file with bounds specified separately:

GeoTiffRasterLayer gtrl = new GeoTiffRasterLayer(tifFile, fileBounds);

…where fileBounds is a RectangleShape. All these layers are added to a single LayerOverlay.

Not sure where the TileViewInMemoryCache applies - it’s not a property of the overlay?

Thanks,
J.

…worth mentioning we also have shape file layers - a number of MultipleShapeFileFeatureLayer layers in a single LayerOverlay.

Hi Jason,

  1. TileViewInMemoryCache is a property in TileOverlay (which is the base class of LayerOverlay), set it to 0 (= new XyzLruCache(0)) to disable it.

  2. I couldn’t recreate the memory issue, can you narrow it down see if it’s an issue from a specific tif file?

  3. Please install ThinkGeo.Gdal and try GeoTiffGdalRasterLayer, it has better memory management / performance than GeoTiffRasterLayer

Thanks,
Ben

Thanks for your advice Ben, sorry about the delay in getting back to you, we’ve been doing a lot of experiments!
I tried to recreate the problem in a stand-alone app with nothing but ThinkGeo in it (loading the same map overlays as our main application) and found, like you, memory usage was not a problem. So it must have been something to do with our main app…

After a lot of trial and error I think we’ve narrowed it down. We have a SqlServerFeatureLayer and we were using the ExecutingSqlStatement event to intercept the query and modify it prior to execution. It turns out on removing this callback, memory usage looks much better, so we think this is the culprit.
We’re looking at alternative ways to get the point data we need (i.e. creating a database view and creating the layer from that).

Thanks again for your help!

Hi Jason,

No problem, that’s awesome you’ve found the cause of the issue!

It sounds like ExecutingSqlStatement event is hooked up multiple times but never be removed, which blocks the entire tile from being released by GC and thus causing the memory leak. It could be fixed if inheriting the TileView, overriding the Dispose(bool disposing) method, and add
layer.ExecutingSqlStatement -= layer_ExecutingSqlStatement before calling base.Dispose(disposing). Anyway, if you can fix it by creating a view in the database that sounds even better.

Just let us know if you see any more issues.

Thanks,
Ben