Hey
I’m having an issue displaying an S57 map in my WPF app using version 12.2.22.
It seems like some of the elements are transparent.
Loading the same map file into the NauticalChartsViewer sample app does not have this issue.
Cheers

Hey
I’m having an issue displaying an S57 map in my WPF app using version 12.2.22.
It seems like some of the elements are transparent.
Loading the same map file into the NauticalChartsViewer sample app does not have this issue.
Cheers
Hi John,
NauticalChartsFeatureLayer has many properties to decide to show or hide some specific features, like daylight mode, night mode, here’s some code you could refer to:
NauticalChartsFeatureLayer layer = new NauticalChartsFeatureLayer(@"TestData/S57/US1HA02M/US1HA02M.000");
layer.IsDepthContourTextVisible = true;
layer.IsLightDescriptionVisible = true;
layer.SymbolTextDisplayMode = NauticalChartsSymbolTextDisplayMode.None;
layer.DisplayCategory = NauticalChartsDisplayCategory.All;
layer.DefaultColorSchema = NauticalChartsDefaultColorSchema.DayBright;
layer.SymbolDisplayMode = NauticalChartsSymbolDisplayMode.Simplified;
layer.BoundaryDisplayMode = NauticalChartsBoundaryDisplayMode.Plain;
Since NauticalChartsViewer works fine, you could also take a look at source code of NauticalChartsViewer to figure out the properties you need.
Thanks,
Leo
HI Leo,
Unfortunately this did not work. I tried the same settings as the NauticalChartsViewer sample app and they still had the same issue.
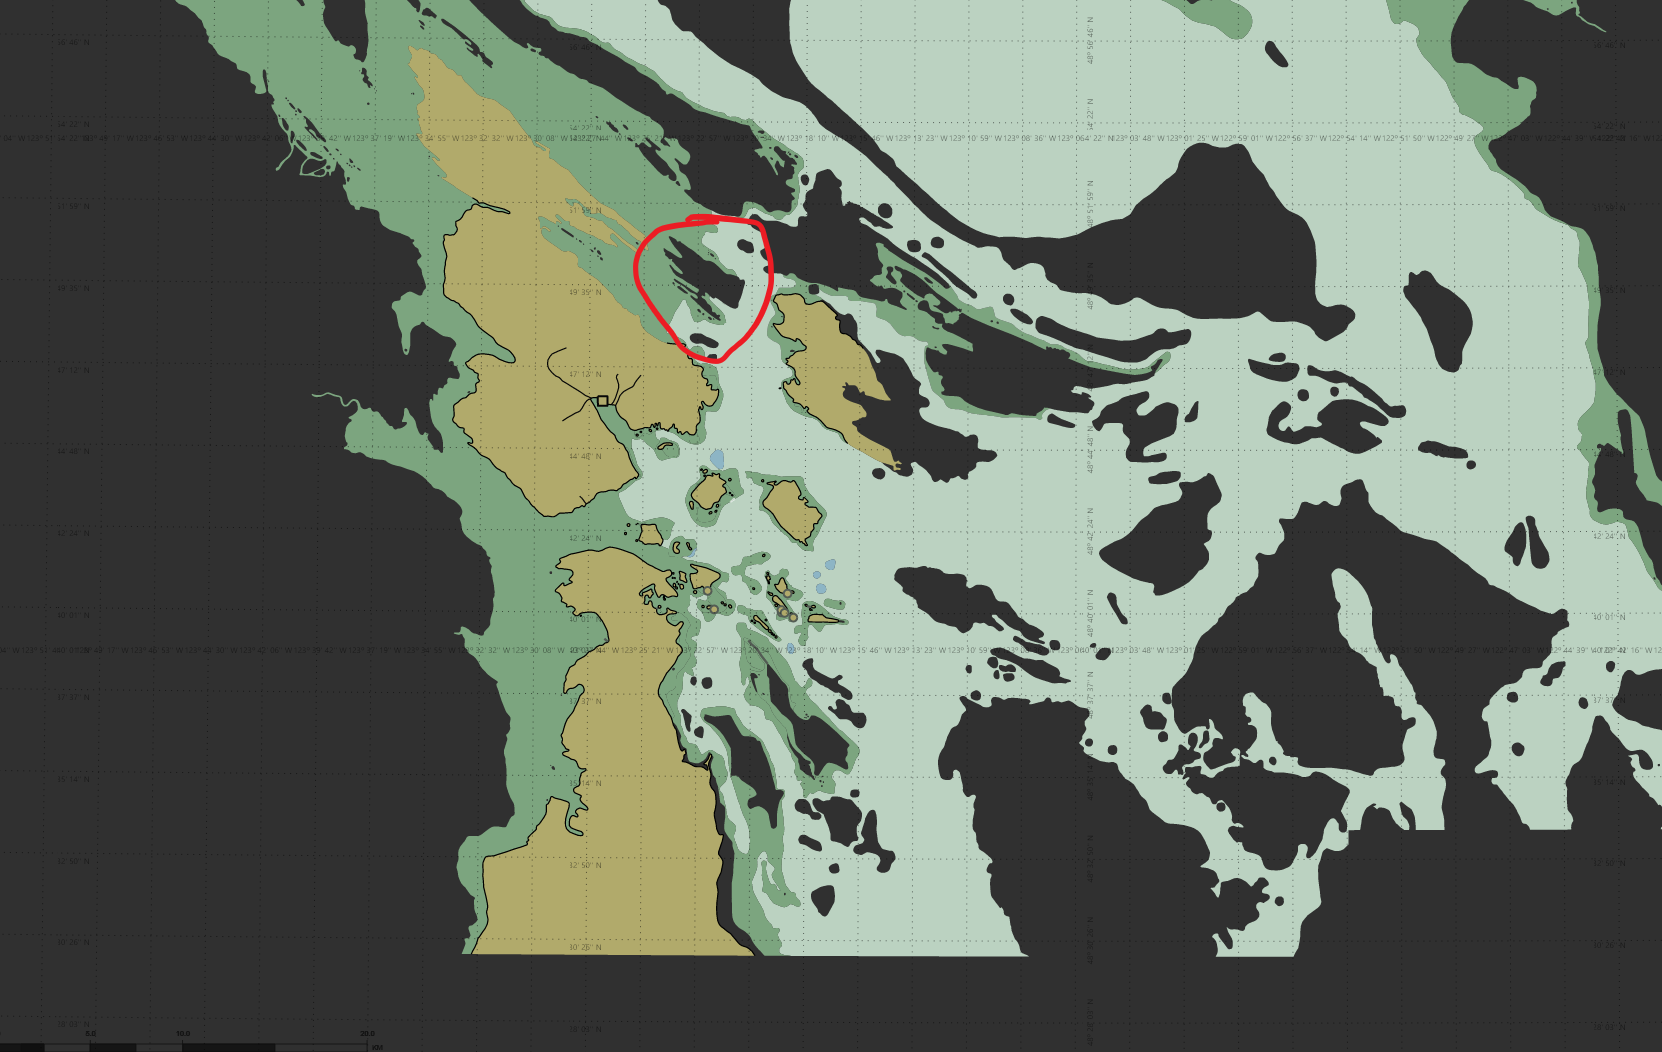
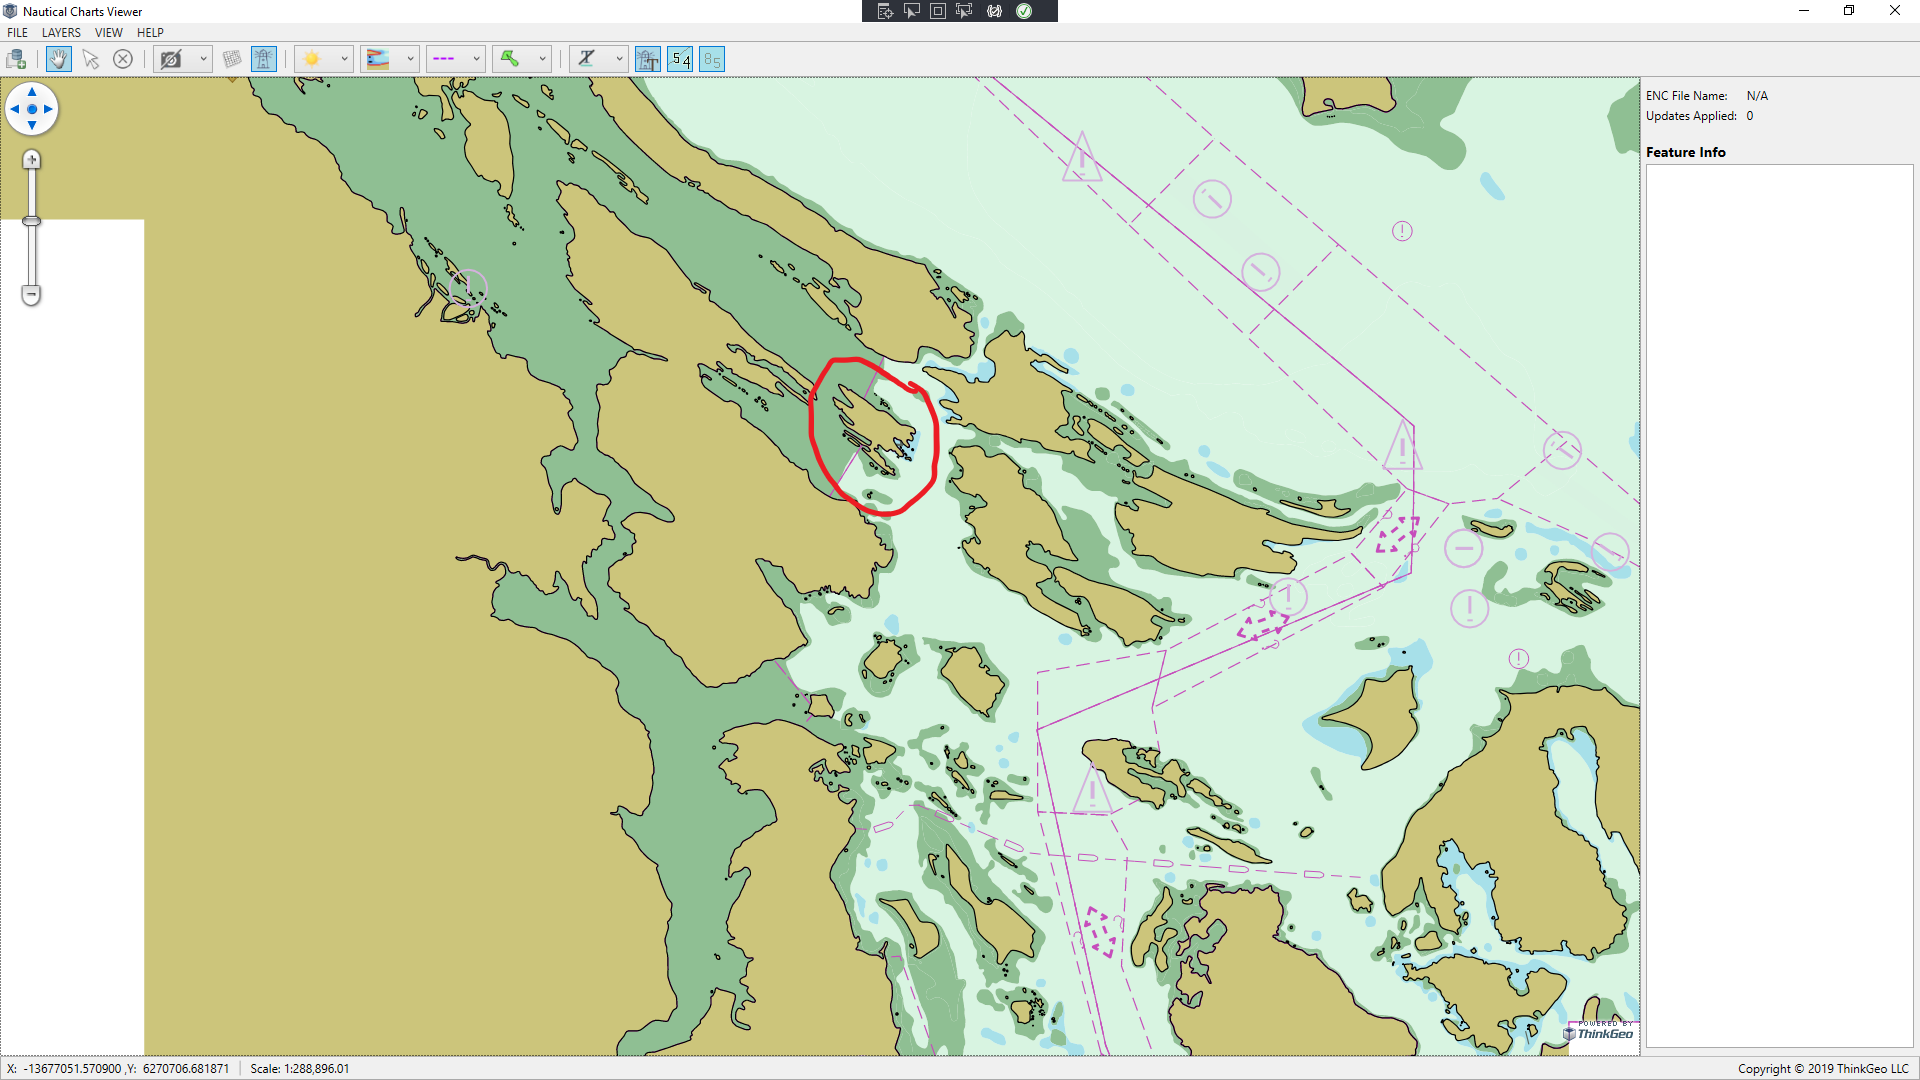
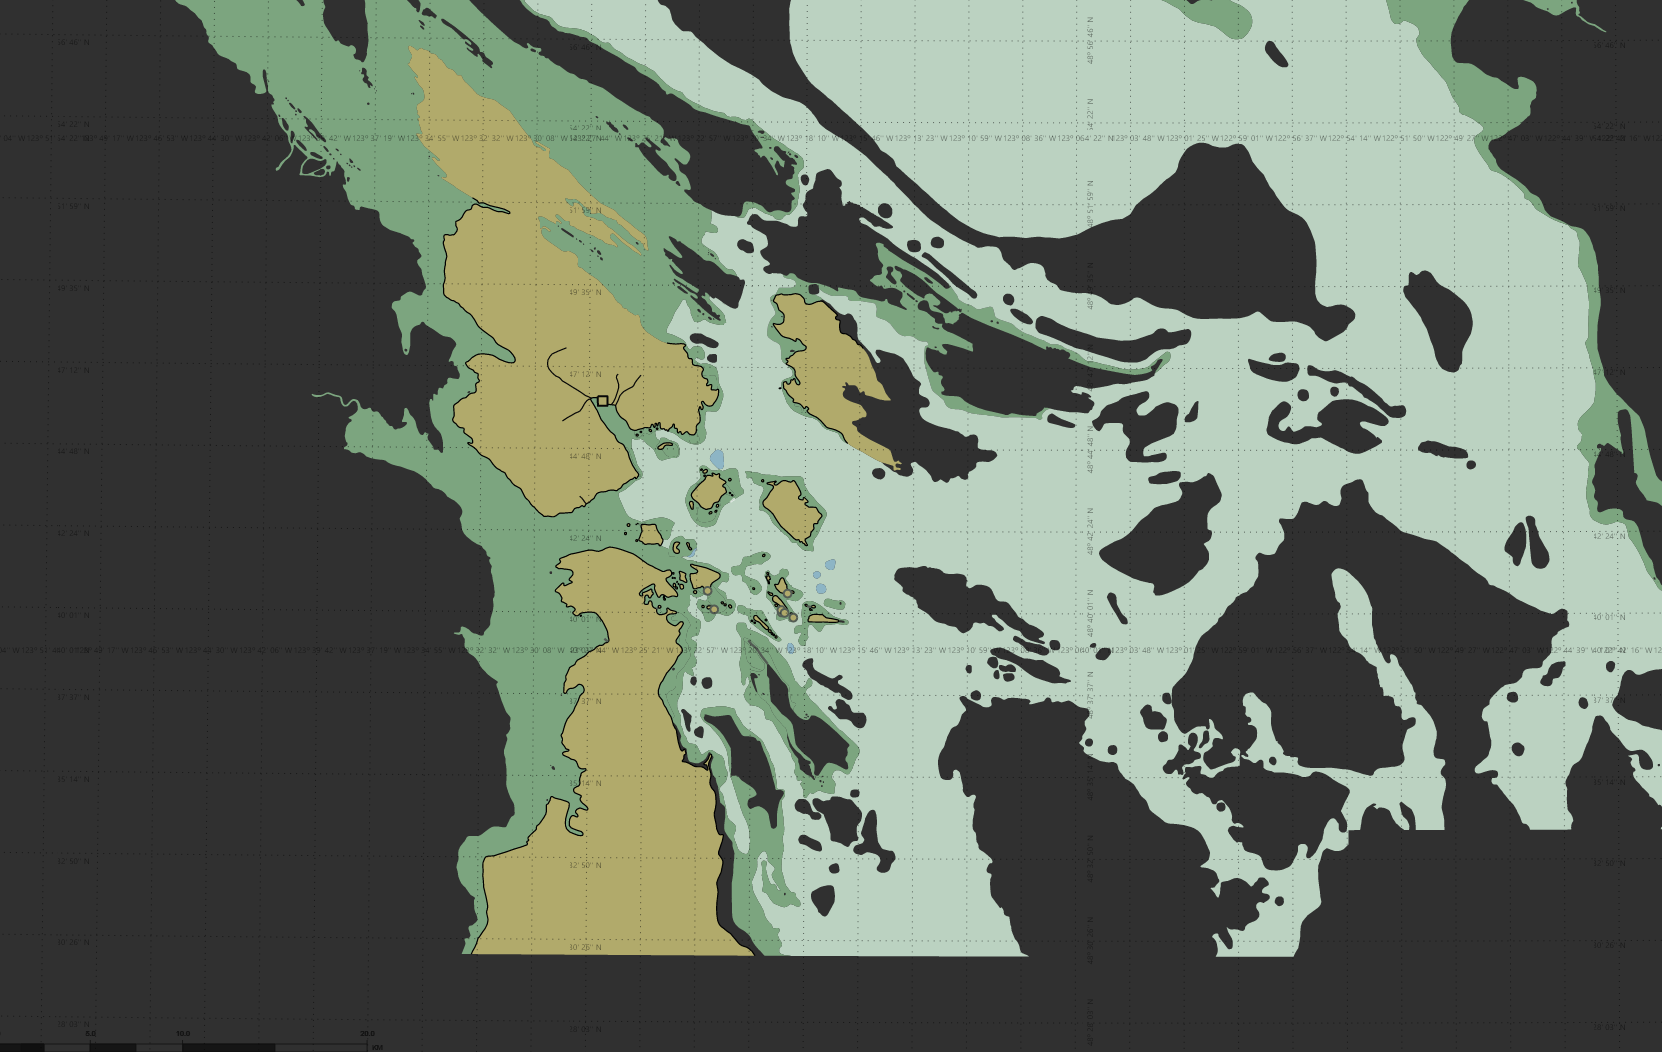
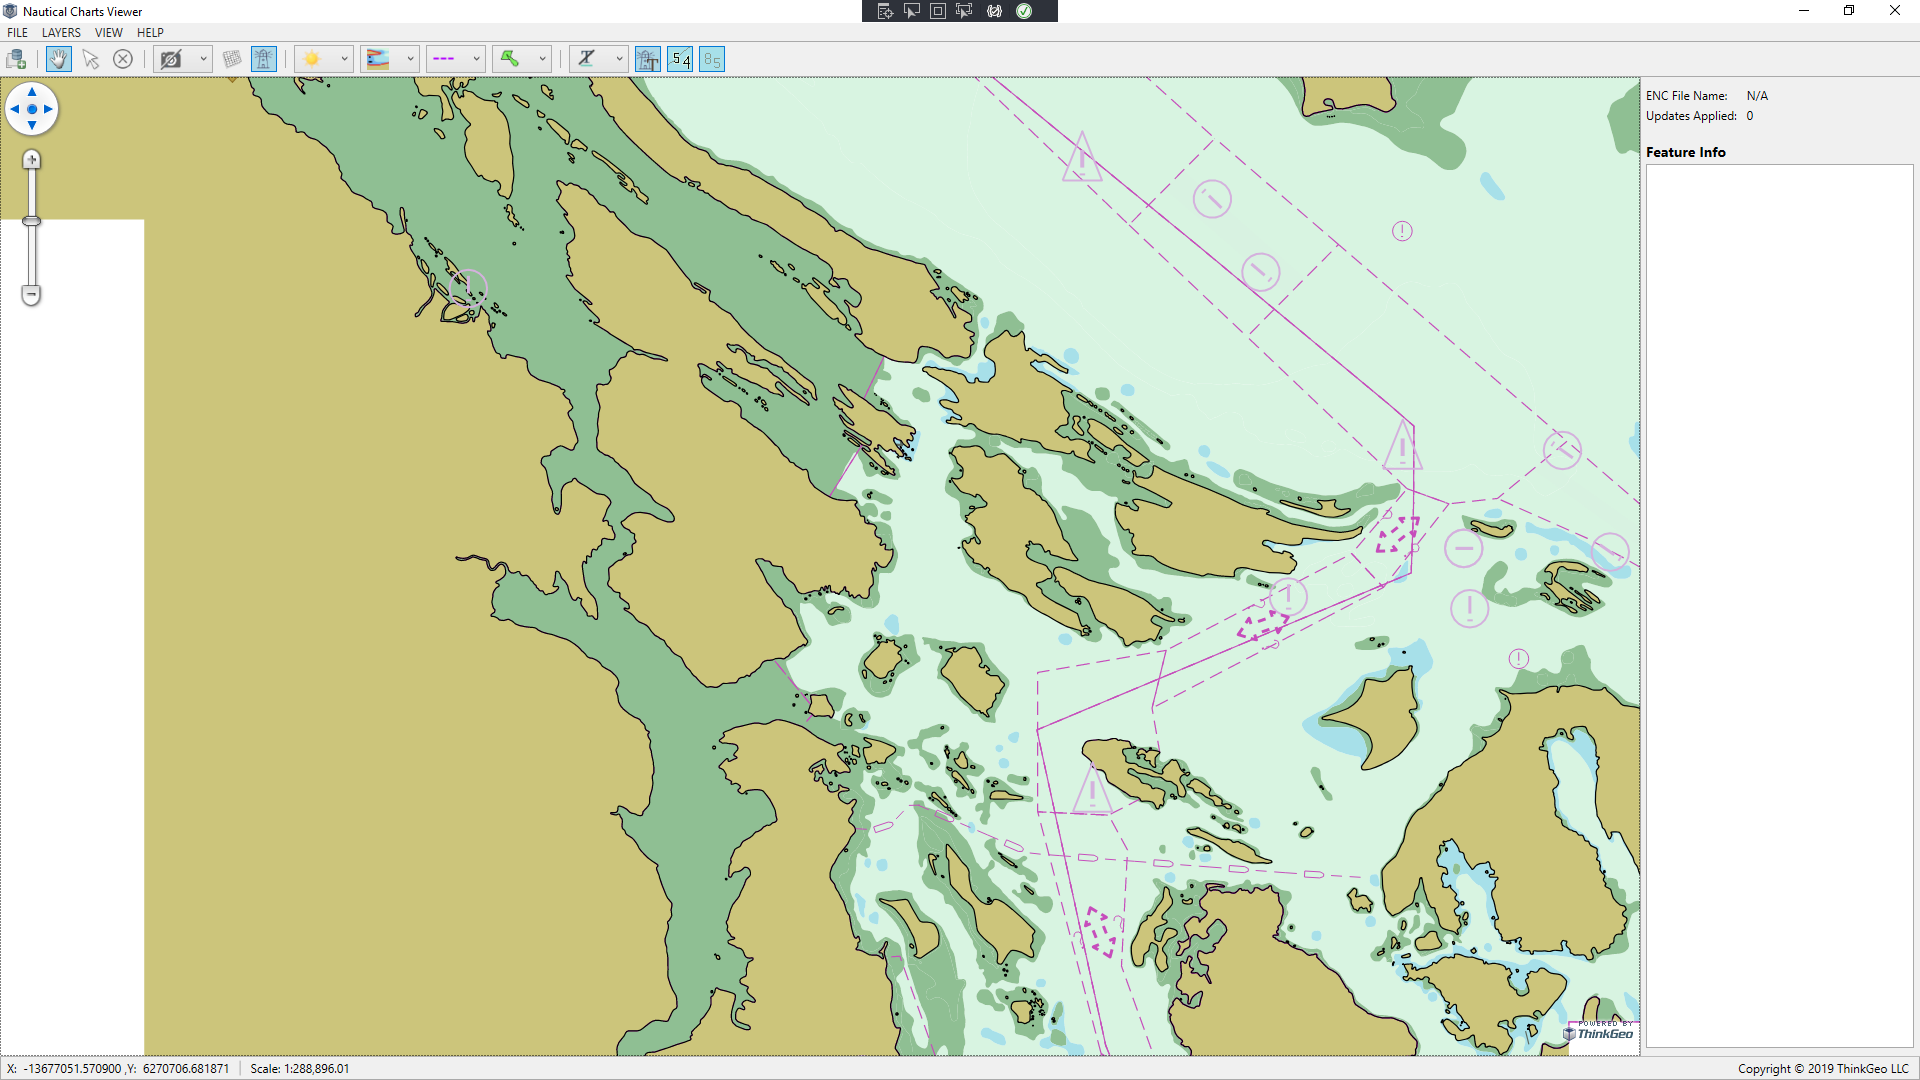
See the highlighted areas in the included images (the one on the top is my app)
It seems like some of the chart is transparent when it should have have data.
I’m using TileType.SingleTile and GeographyUnit.Meter like the NauticalChartsViewer sample. I’m not sure what else could be different to cause this kind of behaviour.
Cheers,
John
Hi John,
Did you check the source code of NauticalChartsViewer? The sample code I posted previously doesn’t include the complete settings. You could take a look the source code and figure out all the settings you use in NauticalChartsViewer.
Thanks,
Leo
HI Leo,
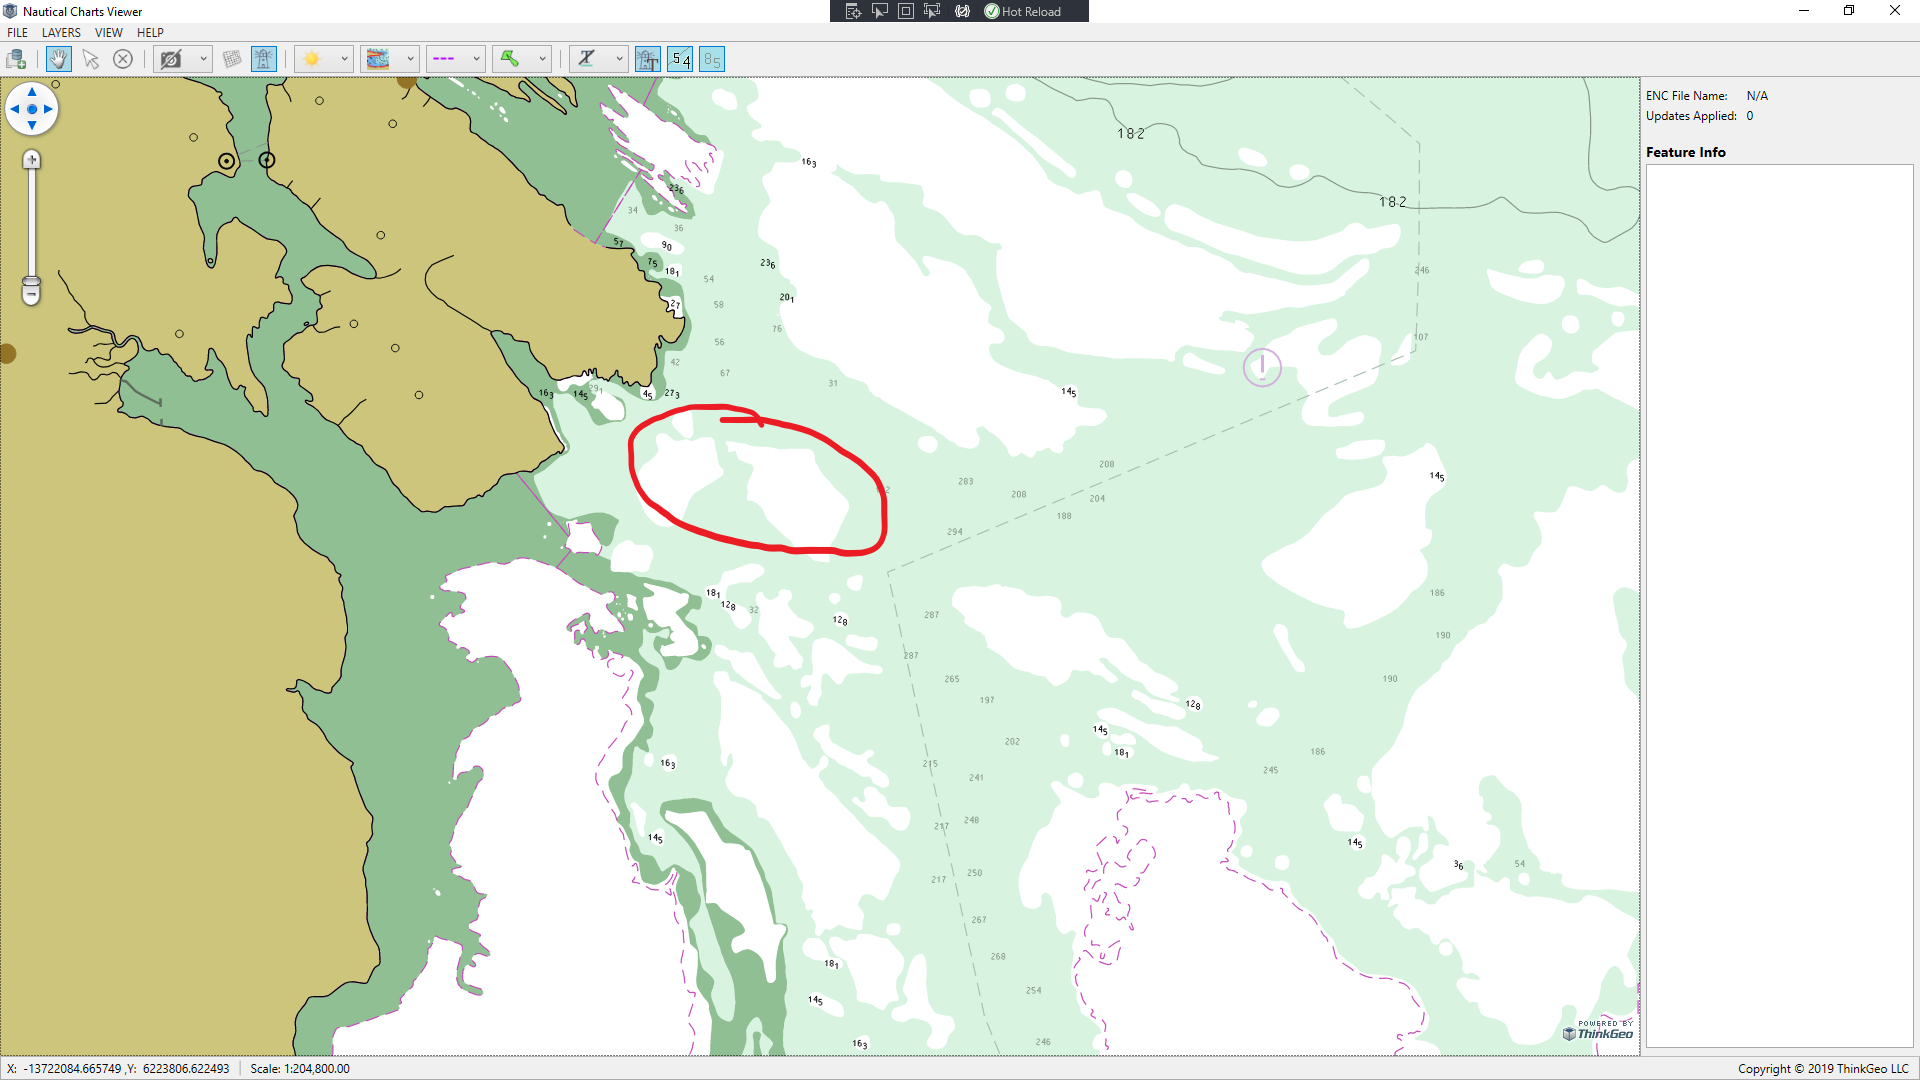
I’ve managed to replicate the same issue on the NauticalChartsViewer app.
Adding the following code to the HandleLoadChartMessage method in MainViewModel:
var zoomSet = new ZoomLevelSet();
zoomSet.ZoomLevel01.Scale = 204800;
zoomSet.ZoomLevel02.Scale = 102400;
zoomSet.ZoomLevel03.Scale = 51200;
zoomSet.ZoomLevel04.Scale = 25600;
zoomSet.ZoomLevel05.Scale = 12800;
zoomSet.ZoomLevel06.Scale = 6400;
zoomSet.ZoomLevel07.Scale = 3200;
zoomSet.ZoomLevel08.Scale = 1600;
zoomSet.ZoomLevel09.Scale = 800;
zoomSet.ZoomLevel10.Scale = 400;
zoomSet.ZoomLevel11.Scale = 200;
zoomSet.ZoomLevel12.Scale = 200;
zoomSet.ZoomLevel13.Scale = 200;
zoomSet.ZoomLevel14.Scale = 200;
zoomSet.ZoomLevel15.Scale = 200;
zoomSet.ZoomLevel16.Scale = 200;
zoomSet.ZoomLevel17.Scale = 200;
zoomSet.ZoomLevel18.Scale = 200;
zoomSet.ZoomLevel19.Scale = 200;
zoomSet.ZoomLevel20.Scale = 200;
map.ZoomLevelSet = zoomSet;
I was able to replicate this on multiple other chart that I got from:
https://charts.noaa.gov/InteractiveCatalog/nrnc.shtml
US3GC04M was one such of these charts (unfortunately not the one pictured above)
Cheers,
John
Hi John,
Could you upload the file you using in the above screenshot? Or could you tell us how to download the file from https://charts.noaa.gov/InteractiveCatalog/nrnc.shtml?
Thanks,
Leo
Hi Leo,
Sorry for taking so long to get back to you, I hope you enjoyed the holiday season.
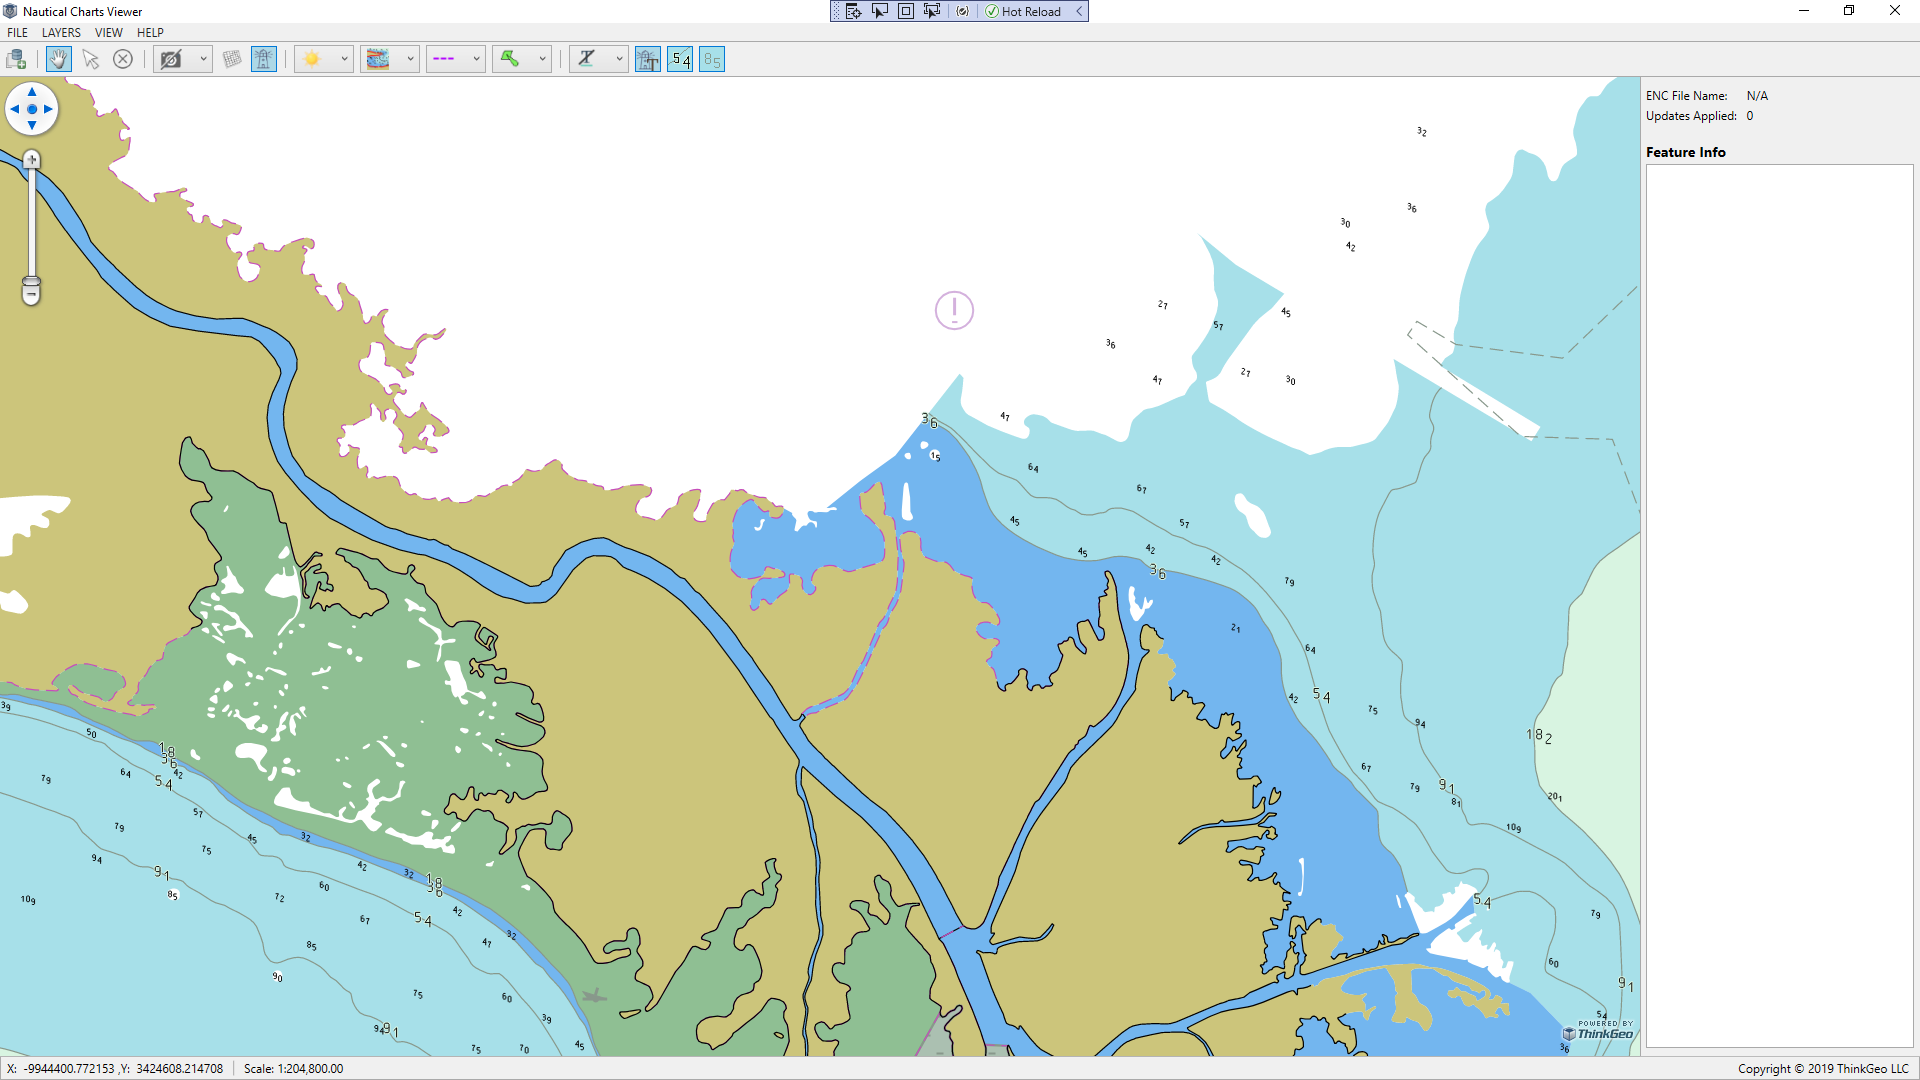
Attached is the file shown bellow.
As you pan around the chart you will notice that several transparent areas.
US3GC04M.zip (1.1 MB)
Cheers,
John
Hi John,
Happy new year.
Your issue has been reproduced, I’m working on how to fix it. I’ll let you know if there’re any updates.
Thanks,
Leo
Hi John,
The issue has been fixed. Feel free to upgrade ThinkGeo.NauticalCharts to 13.0.0-beta317 or above.
Thanks,
Leo