ThinkGeo.com    |     Documentation    |     Premium Support

WPF beta 147: bad performance GPU render / lag

Hi Ben, I’m back

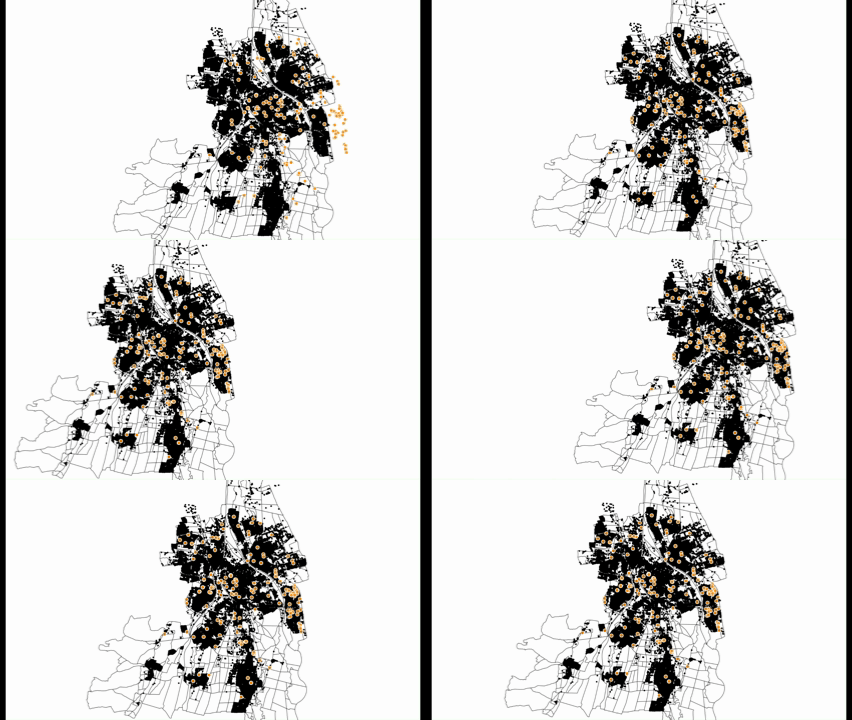
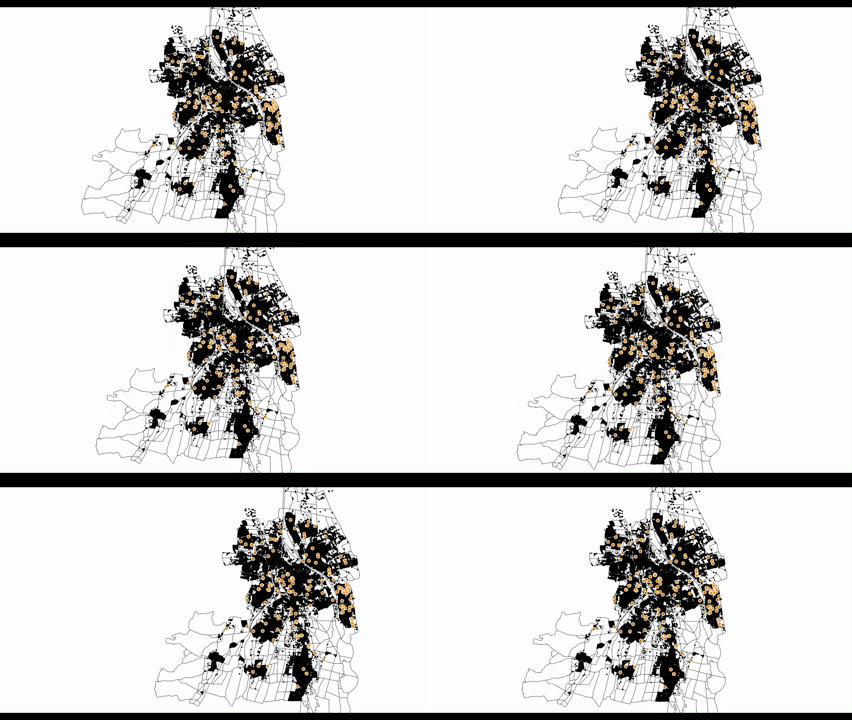
We are getting terrible performance from dragging a map with highlights:

GPU:

gpu_render


CPU:

cpu_render

As you can see GPU is rubberbanding and generally way slower.

With beta148, the background map pans smoothly using GpuBasemap, but classic SingleTile highlight overlays lag and rubberband relative to it. With GPU disabled, the same highlights track smoothly and
navigation is substantially faster. Could there still be a synchronization issue between GpuBasemap and LayerOverlay after the beta147 fix?

Maybe a more broad question on the setup we have:

We render our layers with gpu, but our highlight overlay with cpu above it in the example above.

We now updated to both GPU and that fixed the rubberbanding (still possibly an issue worth reporting).

However, the performance of GPU is way worse than what CPU puts out when dragging. We are still investigating. But if you see anything obvious let us know.

Hi Julian,

What we could and could not reproduce

What you reported Us
GPU basemap + classic SingleTile highlights: highlights rubberband Reproduced on beta146 (45 px). Not on beta147 (1.2 px).
Same setup: generally slower than CPU Not reproduced
Both on GPU: no rubberbanding, but still slower than CPU Not reproduced

The rubberbanding is the defect behind your post 12453, fixed in beta147.

The slowness we could not reproduce. We tried a real 15,196-feature street network, that network replicated 16x with labels, tilted and flat, cold and warm — the frame never became the problem (2 ms of draw for 18 tiles). So the time is not going into the renderer itself.

But we did find something that could explain a slowness that comes and goes, so Is it slow steadily, or does it come and go? Specifically — does it start fine and degrade after some panning and zooming, then recover on its own and degrade again? If it is the second, we have identified this issue and will have a fix for you shortly. If it is slow from the first frame, it is something else and the log below is what we need.

What would help us

  1. Which beta are the two recordings from, and does the rubberbanding still happen on beta150?
  2. For the slowness, a GPU log. Environment variables alone will not produce one — the log level defaults to “none” and there is no default destination — so please add this at the very start of Main, before any ThinkGeo type is touched:
Environment.SetEnvironmentVariable("PRELUDE_CUT_PROBE", "1");
Environment.SetEnvironmentVariable("PRELUDE_GPU_TIMERS", "1");

ThinkGeoDebugger.LogType  = ThinkGeoLogType.Gpu;
ThinkGeoDebugger.LogLevel = ThinkGeoLogLevel.Message;
ThinkGeoDebugger.LogStreamWriter = new StreamWriter(@"C:\temp\gpu.log", false) { AutoFlush = true };

Then drag until it feels bad and send us the file. The [FrameCost], [CutTile] and [PresentCost] lines say whether the time is in the frame, in cutting tiles, or in presenting.

Thanks,
Ben

Hi Ben, thanks for doing way more work than I expected of you, here is the requested log:

(renamed to .txt because the forum doesnt allow .log)

gpu.txt (131.6 KB)

What happened here: I displayed all addresses as icons on the map as highlights and then dragged the map around. I then switched to CPU rendering and dragged the map around again.

No rubberbanding visible (but both highlight and classic are GPU now, so not unexpected) - but the performance is super slow. Compared to CPU rendering which loads faster and also drags super smooth once it finishes rendering, while GPU seems to be doing additional work on panning.

Another thing I noticed: When alt tabbing out and back in to the application, CPU seems to be also laggy - this is fixed by resizing the map

lag_until_resize

Sorry the forum only allows terrible quality gifs - I promise the difference is like 10fps compared to 60fps.

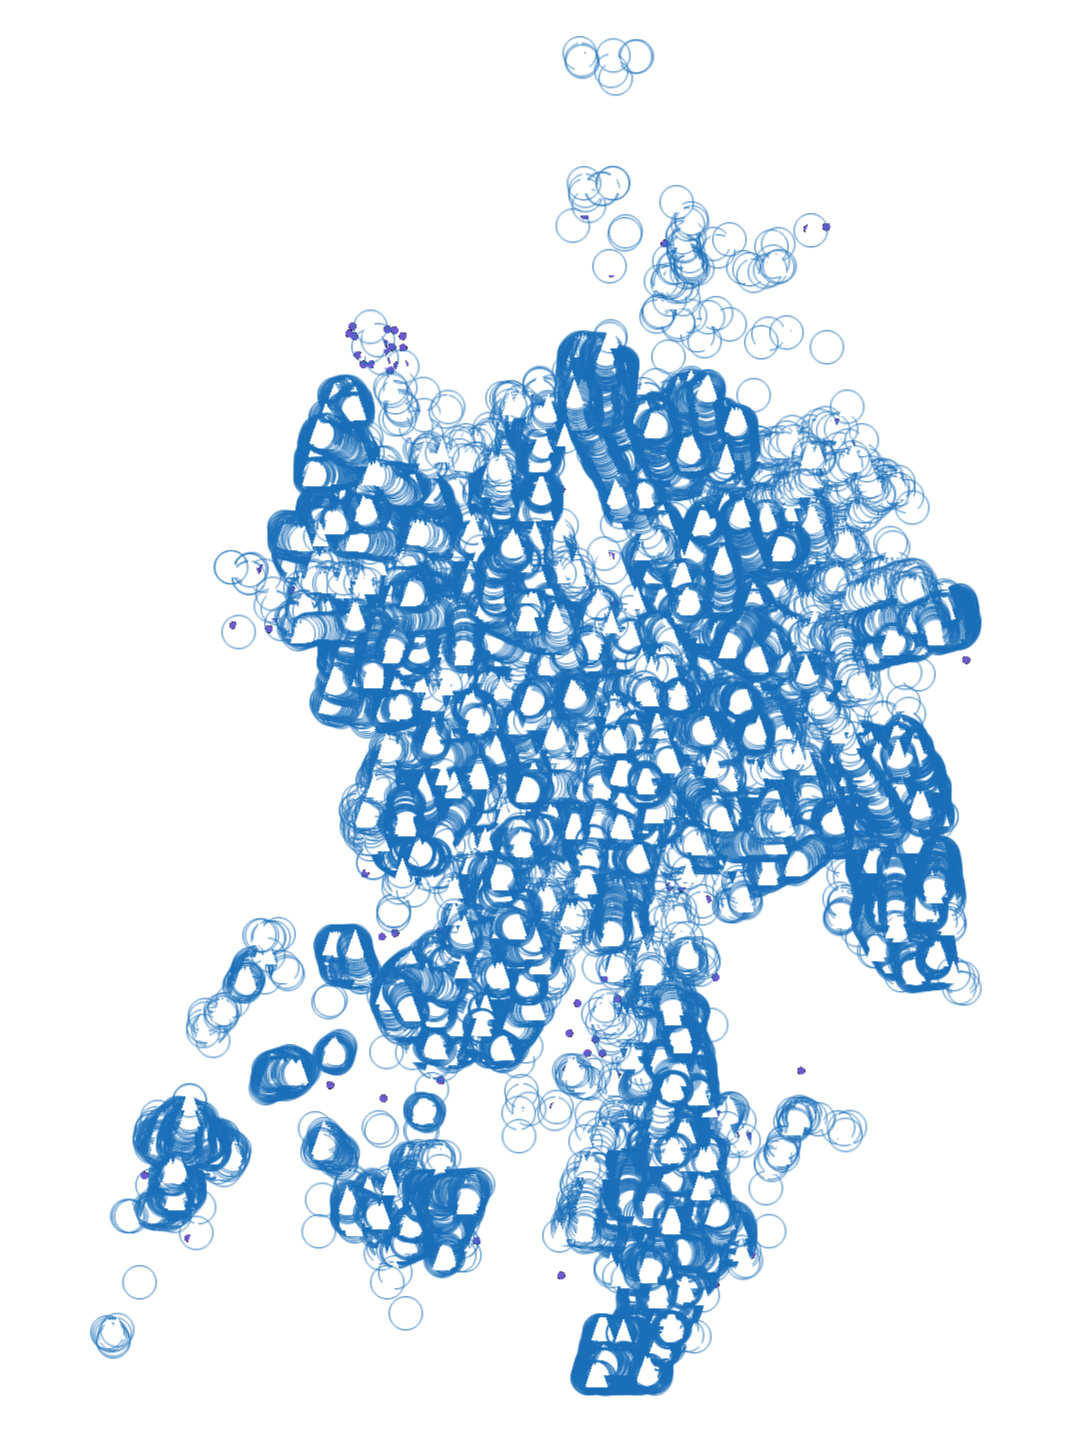
While trying to reproduce that on GPU I noticed another thing: Resizing seems to make Icons disappear on GPU?

Hi Julian,

That log is exactly what we needed - thank you. It answers the question we could not answer from our side.

The time is not in the rendering. Your GPU passes take 0.45 ms in the median; presenting the finished frame takes 22.6 ms, and the composition rate that falls out of that is 19-25 frames a second. That matches the difference you described. So the cost sits in the path that hands our finished frame to WPF, not in drawing your data, and it shows up on your setup in a way it does not on ours. We have a lead there and we can see things to improve.

We will work on it and come back to you with a build.

Two other things from your log and your notes, so they are not lost. Cutting vector tiles from your source is genuinely expensive at low zoom - 46,176 features in one tile at 3.3 s, 41,095 in another at 2.5 s. That runs off the UI thread, so it is not what makes the drag stutter, but it is why new areas take a while to fill in; pre-building a PMTiles archive for that layer would remove it. And icons disappearing after a resize on GPU is a separate defect - we will look at that one on its own.

Thanks,
Ben

Hi Julian,

I’m afraid we need some more information to get to the bottom of it. Could you run the same test on beta154 and send the log again? Same setup as last time, one line added:

Environment.SetEnvironmentVariable("PRELUDE_GPU_TIMERS", "1");
Environment.SetEnvironmentVariable("PRELUDE_TILT_PROBE", "1");   // only if you tilt
ThinkGeoDebugger.LogType  = ThinkGeoLogType.Gpu;
ThinkGeoDebugger.LogLevel = ThinkGeoLogLevel.Message;
ThinkGeoDebugger.LogStreamWriter = new StreamWriter(@"C:\temp\gpu.log", false) { AutoFlush = true };

Drag until it feels bad and send the file.

Thanks,
Ben

Hi Ben, here are two files.
This is with only 2 shapefiles:

gpu_0.txt (1.0 MB)

And this includes the highlight layer too:

gpu_1.txt (941.3 KB)

Latest beta (154)
Also the bug with the icons breaking (invisible) still happens (happed in the middle of gpu_1 if the log shows that) - happens on resize of viewpoint.

Hi Julian,

Thanks for the logs! We located the cause and put the fix in beta157.

Can you run twice, as following:

  1. With no logging at all — no ThinkGeoDebugger, no environment variables. Just drag, and tell us how it feels.

  2. Do the same setup as last time, so we can confirm it against your data. This time we expect [PolyLabelMove] to fall from ~5500 lines to under 200.

Your icons disappearing after a window resize — we will come back to you on that one separately.

Thanks,
Ben

Hi Julian,

We couldn’t reproduce the icons-go-invisible issue. Can you do another round of test with ThinkGeoDebugger LogType set to:

ThinkGeoDebugger.LogType = ThinkGeoLogType.Gpu | ThinkGeoLogType.StyleJsonParsing

And send us the log again?

Thanks,
Ben

Hi Ben, here is the log. The last ~20 seconds are when we loaded in the labels and made them go invisible by changing the window size.

gpu_2.txt (1.7 MB)

Hi Julian,

Your log shows it, and it is one we have already fixed in beta160. Can you try the latest and send us the new log file if there’re still issues.

Thanks,
Ben

1 Like