Hi Julian,
What we could and could not reproduce
| What you reported |
Us |
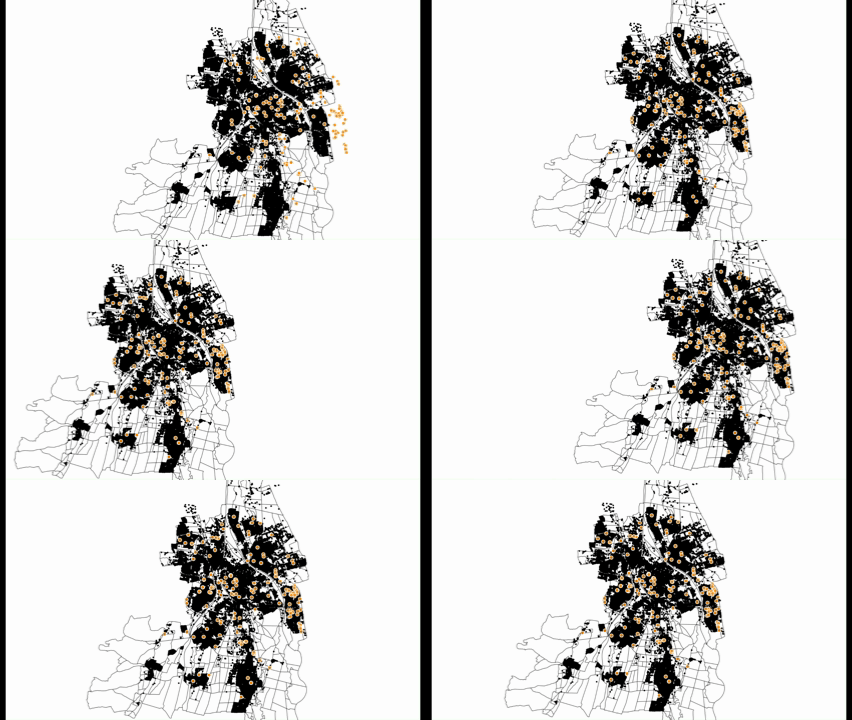
| GPU basemap + classic SingleTile highlights: highlights rubberband |
Reproduced on beta146 (45 px). Not on beta147 (1.2 px). |
| Same setup: generally slower than CPU |
Not reproduced |
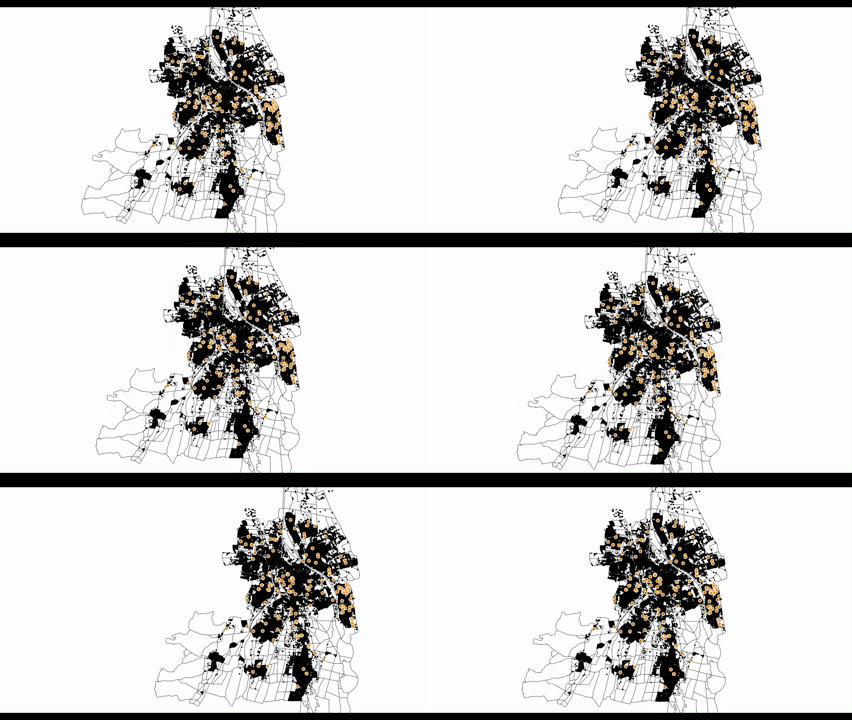
| Both on GPU: no rubberbanding, but still slower than CPU |
Not reproduced |
The rubberbanding is the defect behind your post 12453, fixed in beta147.
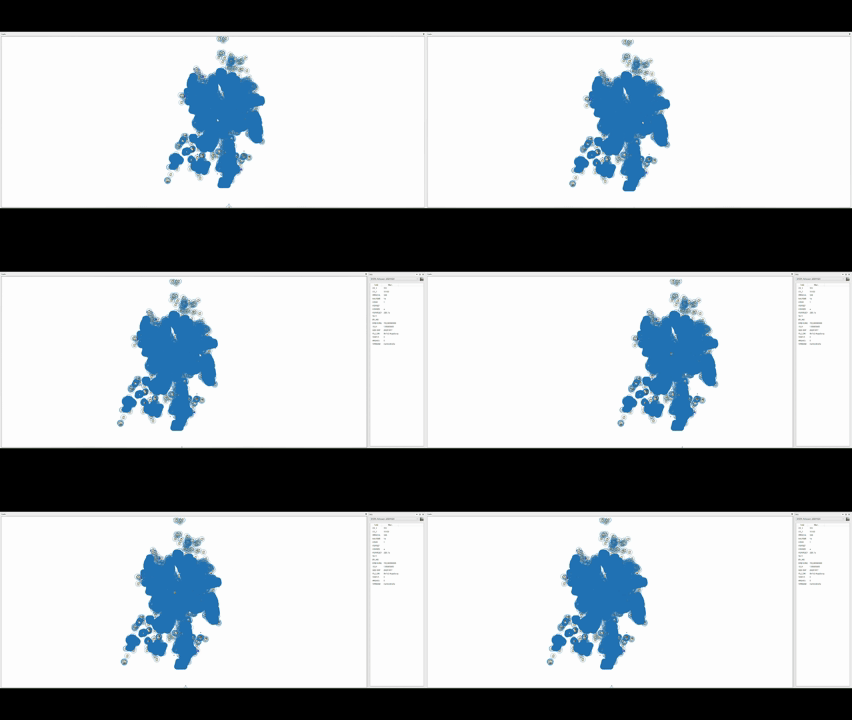
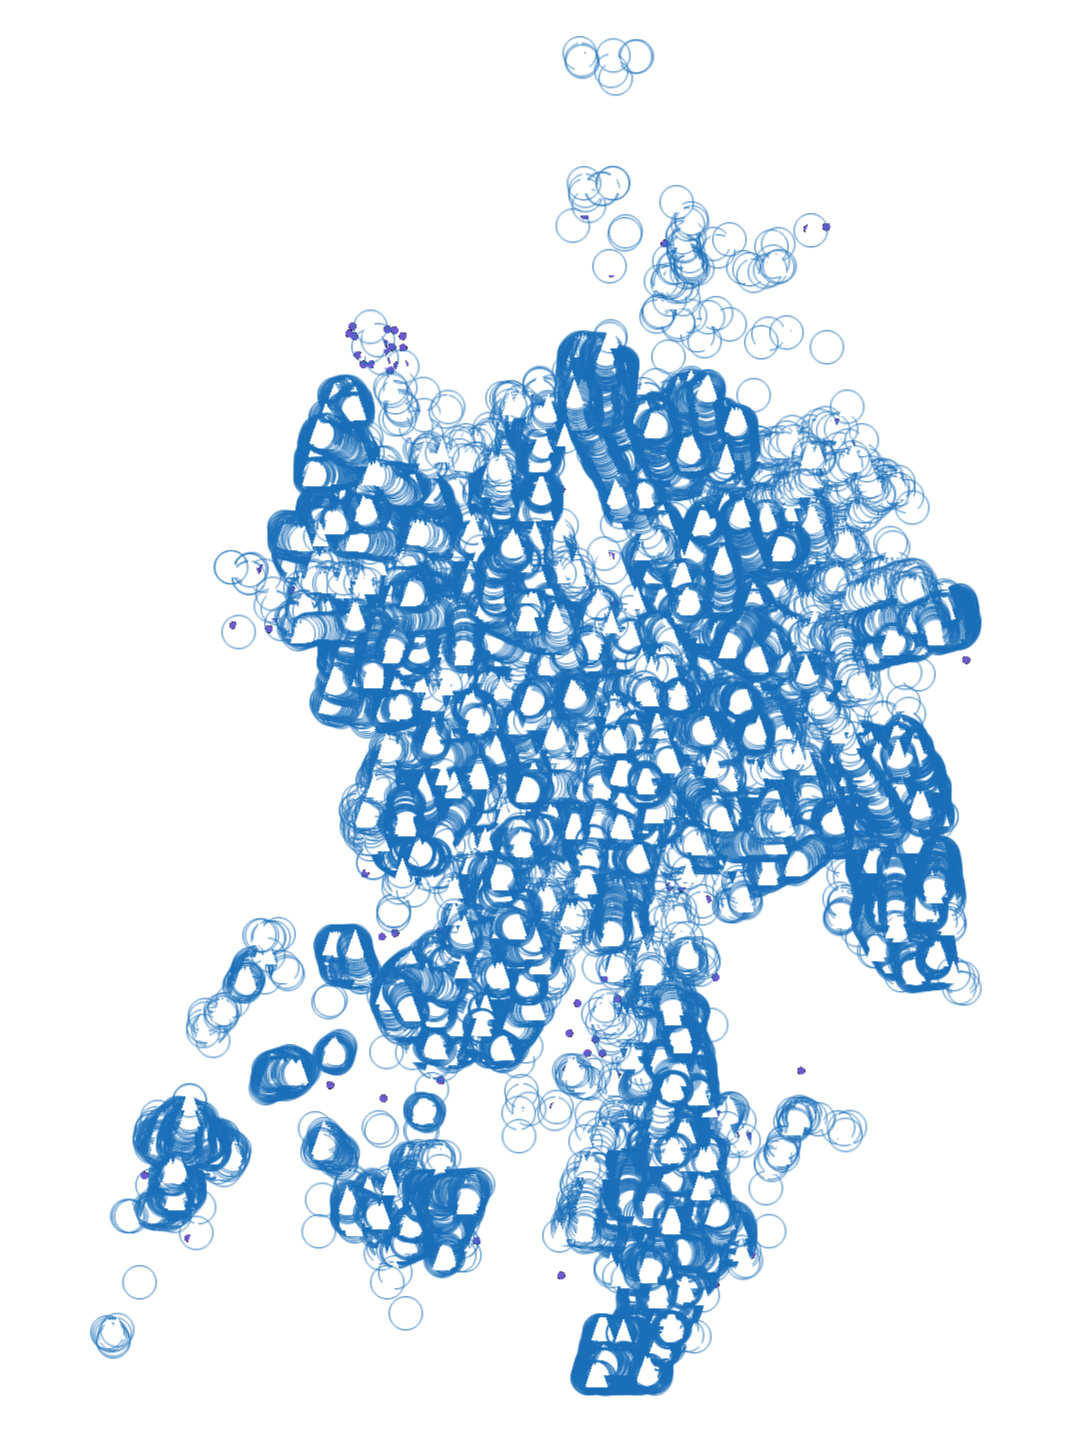
The slowness we could not reproduce. We tried a real 15,196-feature street network, that network replicated 16x with labels, tilted and flat, cold and warm — the frame never became the problem (2 ms of draw for 18 tiles). So the time is not going into the renderer itself.
But we did find something that could explain a slowness that comes and goes, so Is it slow steadily, or does it come and go? Specifically — does it start fine and degrade after some panning and zooming, then recover on its own and degrade again? If it is the second, we have identified this issue and will have a fix for you shortly. If it is slow from the first frame, it is something else and the log below is what we need.
What would help us
- Which beta are the two recordings from, and does the rubberbanding still happen on beta150?
- For the slowness, a GPU log. Environment variables alone will not produce one — the log level defaults to “none” and there is no default destination — so please add this at the very start of Main, before any ThinkGeo type is touched:
Environment.SetEnvironmentVariable("PRELUDE_CUT_PROBE", "1");
Environment.SetEnvironmentVariable("PRELUDE_GPU_TIMERS", "1");

ThinkGeoDebugger.LogType  = ThinkGeoLogType.Gpu;
ThinkGeoDebugger.LogLevel = ThinkGeoLogLevel.Message;
ThinkGeoDebugger.LogStreamWriter = new StreamWriter(@"C:\temp\gpu.log", false) { AutoFlush = true };
Then drag until it feels bad and send us the file. The [FrameCost], [CutTile] and [PresentCost] lines say whether the time is in the frame, in cutting tiles, or in presenting.
Thanks,
Ben